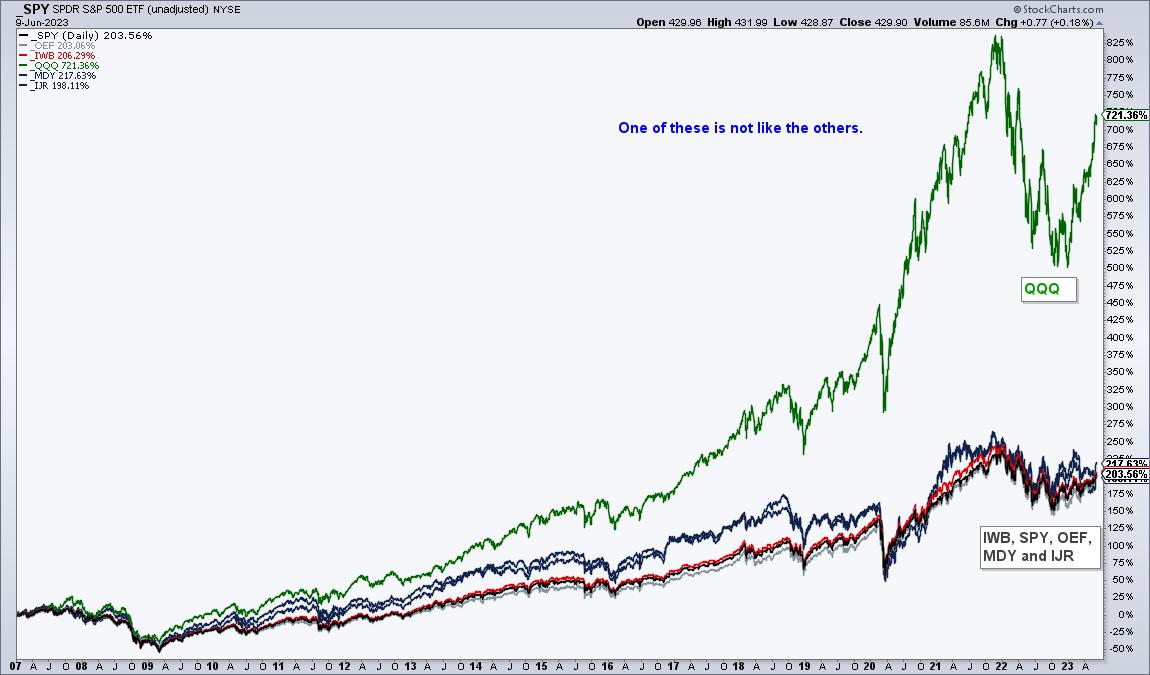
A long-term chart shows why the Nasdaq 100 is the place to be, or at least, “was” the place to be. Past performance does not guarantee future performance. The performance chart below shows the 16+ year percentage gain for QQQ and five other ETFs. These include the S&P 500 SPDR (SPY), S&P 100 ETF (OEF), Russell 1000 ETF (IWB), S&P MidCap 400 SPDR (MDY) and S&P SmallCap 600 SPDR (IJR). These five are grouped together with a total return somewhere in the 200 percent area. QQQ stands out because its total return is over 700%.
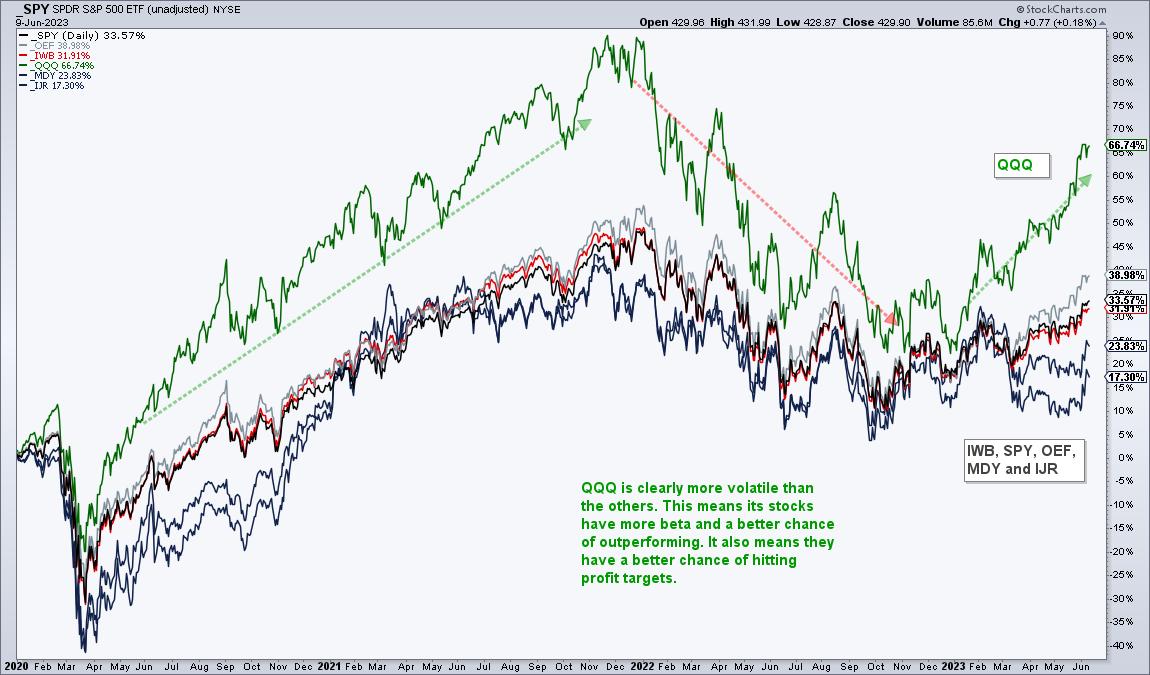
The next chart shows QQQ and the same index ETFs since January 2020. QQQ was up some 138% from the March 2020 low to the November 2021 peak. It then fell some 36% into the October 2022 low and advanced around 36% from October 2022 to early June 2023. These big swings show that QQQ goes up more during broad market advances and falls more during broad market declines. The net result is positive and QQQ is the place to be for traders looking to capture beta. TrendInvestorPro recently introduced a trend-momentum strategy in which Nasdaq 100 stocks seriously outperformed.
What exactly is the Nasdaq 100? The Nasdaq 100 is the top 100 non-financial stocks in the Nasdaq. “Non-financial” is the key word there. Top means stocks with the highest market capitalization. As far as groups are concerned, the Nasdaq 100 includes industrials, technology, retail, telecom, biotech, healthcare, transports, media and services.
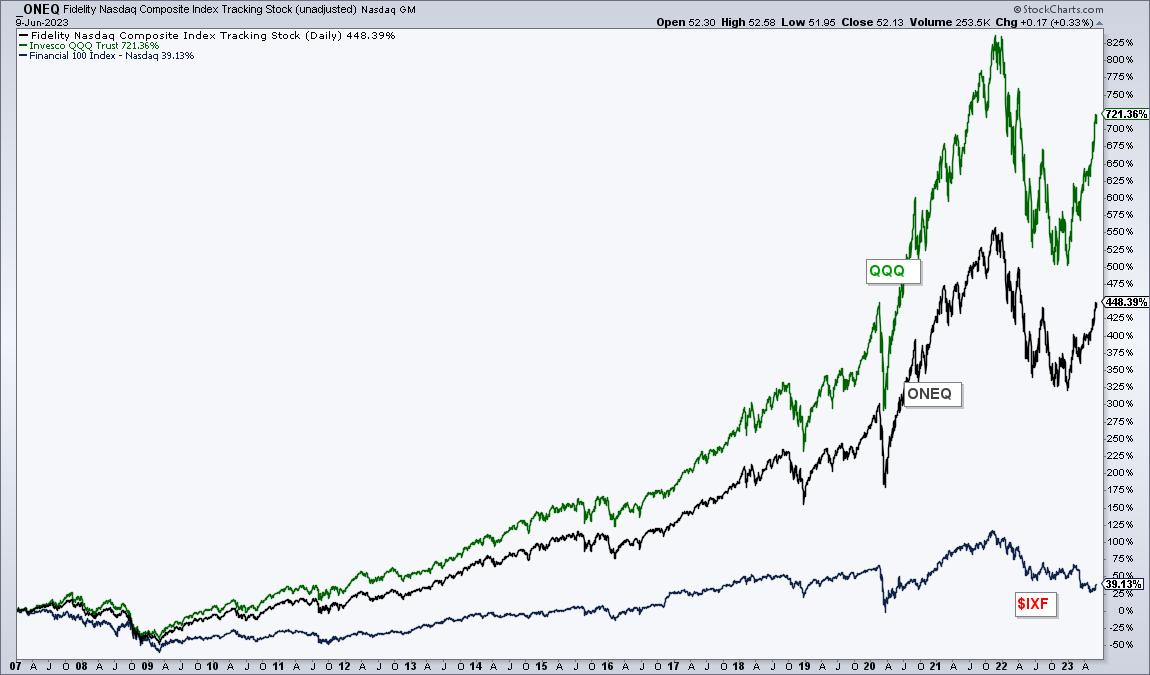
The Nasdaq 100 was created in 1985 and financial stocks were put in a separate index, the Nasdaq Financial-100 ($IXF). This index covers banks, insurance, brokers and mortgage lenders. Clearly, it was a good decision to leave financials out because $IXF is up just 38% since January 2007. The chart below shows performance for QQQ, the Nasdaq Composite ETF (ONEQ) and the Nasdaq 100-Financials Index ($IFX). Financials?! We don’t need no stinkin financials. I would also say the same for utilities, staples and REITs.
TrendInvestorPro recently introduced a trend-momentum strategy using Normalized ROC to trade Nasdaq 100 stocks. This strategy also uses the Composite Breadth Model and Trend Composite, as well as the Exponential Slope to set a momentum minimum. Subscribers get access to an article detailing the strategy and showing performance metrics. Click here for immediate access.
Normalized-ROC, the Trend Composite, ATR Trailing Stop and nine other indicators are part of the TrendInvestorPro Indicator Edge Plugin for StockCharts ACP. Click here to take your analysis process to the next level.
—————————————