The stock market is a bull/bear battle every day. Last week as the $SPX touched the 200-day moving average, the market stalled. This week, the market dropped Monday and Friday, creating a big weekly down candle to follow on last weeks stall.
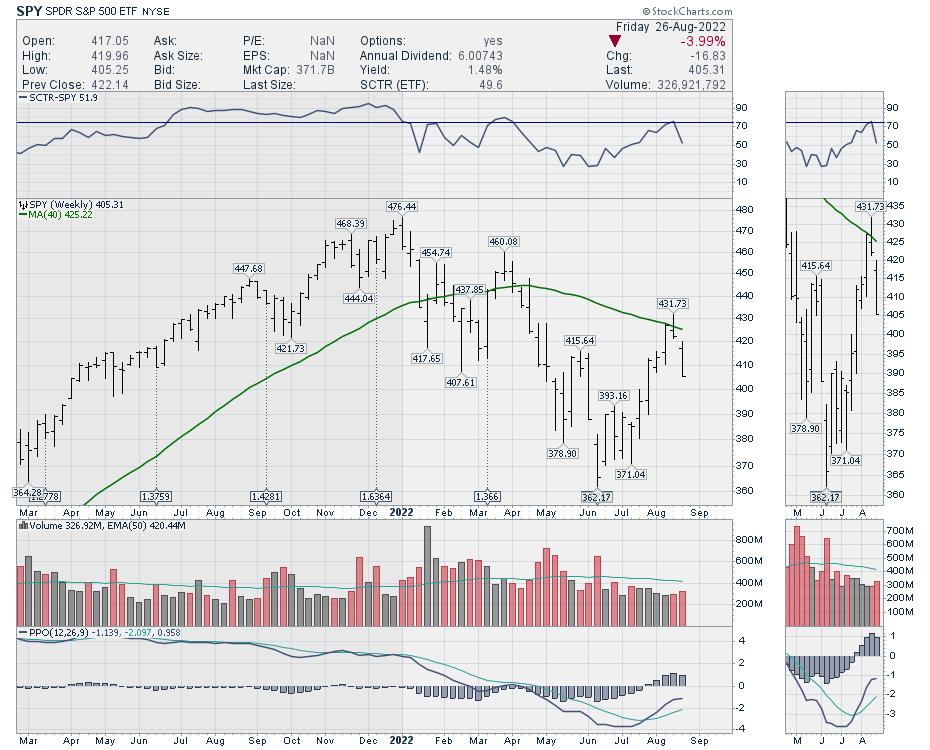
Weekly Chart
If a fundamental investor is looking for these data points, they are hard to find. For a technician, the information is jumping off the chart, sitting in plain view.
So what are the conditions that make this chart have so much peril?
- Down-sloping 40-week moving average.
- Failing bounce into the underside of the 40 WMA. Typical in big bear markets.
- SCTR unable to get back above 75. SPY is usually one of the strongest ETFs.
- Low volume on the rally
- Weekly PPO was below zero, warning to remain cautious of being a bear market rally.
At Osprey Strategic, we spend a large amount of time and effort into trading with the tail winds, and avoiding the downtrends.
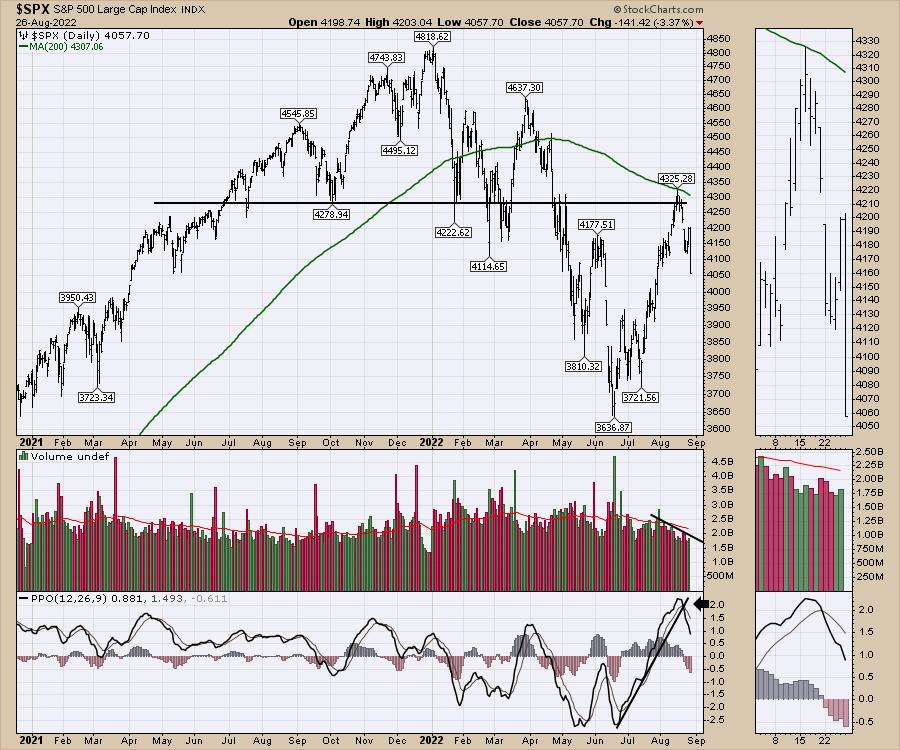
Daily Chart
The daily chart is also helpful.
- Bear market rallies have sudden surges to get shorts to cover. This was quick.
- The index stalled at the 200 day moving average. Classic bear setup.
- Price stalled at horizontal support and resistance.
- Price was unable to break the downtrend of lower highs
- The PPO rolled over to a sell signal after a 2-month bear market rally, signalling caution is warranted
- declining volume each day as the market moved up
So what am I looking for to show the trend reversing?
There are lots of signals not shown here, and they all go towards the interpretation. Typically, you’ll see a group of charts change. Then another, and another. On the Market Buzz this week, I worked through the FANG names and discussed why the next few weeks could be telling. I highlighted some ideas of what would flip me to a longer term bullish outlook.
We also have a process using the Schnell Strength Indicators to help define when the market is strong. Below is an example.
Our buy signal in June (Options Expiration) was timely, and our sell signal in August (Options Expiration) has been timely as well. I was very frustrated (losing trades) by the churn in late June and the first 1/2 of July. Trading with the market’s main trend is hard enough. It is really hard trading against it.
If you’d like more information on investing with the trend, I’d encourage considering our unique thought process of only being invested when the trend is favourable. Even then, it’s still hard work, especially within a big bear market. But being on the right side of a new bull market early, is one of the best times to be involved. We use Schnell Strength Indexes to determine the wind direction.
Its a whole new way of looking at the market, but trading with a tailwind is a lot more fun than trading through a headwind.
SSI Indicators
We like to buy when these SSI indicators are turning up off low readings, and be ready to sell when they turn down off high readings. The three different lines use different methods to calculate market direction. Two of the lines are a lot faster than the blue line. The red one was the first to fire higher in June.
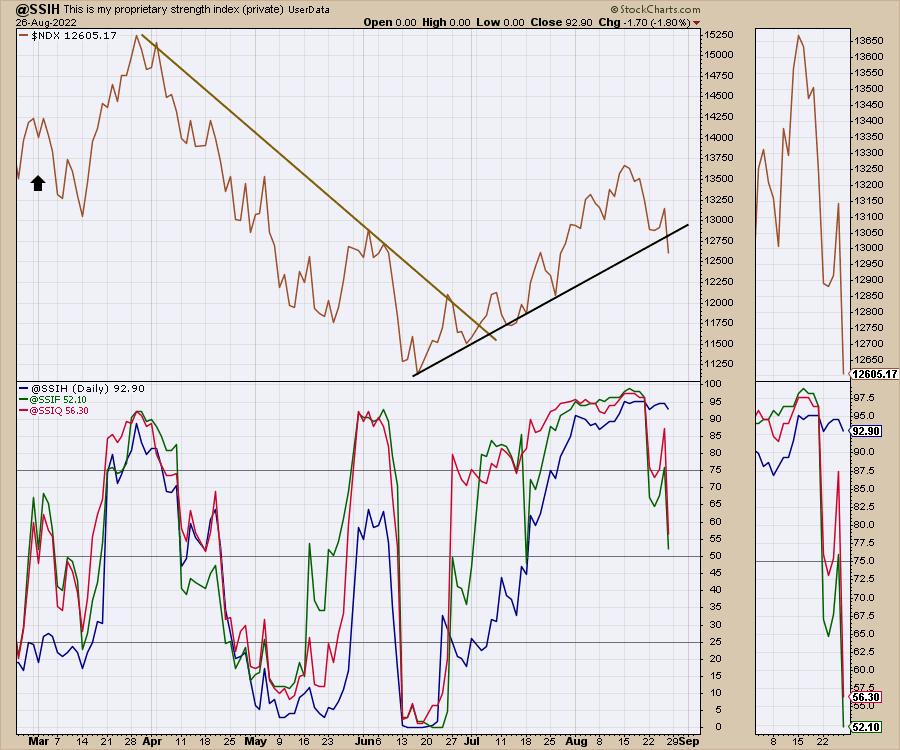
The most dangerous part is waiting four weeks, then starting to put money to work when it feels safe. The Nasdaq is already back to the level of 5 weeks ago, July 21st!
It takes a while to understand the swings. If you miss one, you’ll catch the next one. For me, the SSI signals help me refrain from buying in near the highs, and to wait for a low to form. There is always a rally we can get onboard with. In 2021 we had 8 signals and this year we have a had 4 buy signals. Two were very brief!
If you are finding the market quickly taking away the 2 months of gains you have made, perhaps we can help at Osprey Strategic.org. No pressure, as we have a one-month $7 trial or check our home page for other plans.