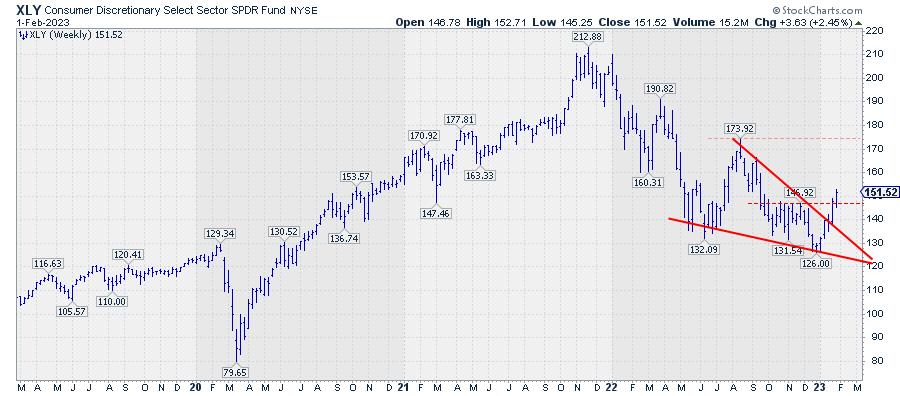
In the second half of 2022, the price chart for XLY started to form a falling wedge pattern.
This pattern or formation is characterized by two converging trendlines, BOTH moving lower. The falling wedge variant comes in two variations. It can be either a continuation within an established uptrend or a reversal pattern at the end of a downtrend. Either way, the falling wedge is considered to be a bullish formation.
You can read more on falling wedges in this ChartSchool article.
In the case of XLY, the wedge started forming in mid-year 2022 when the price bottomed around 132 twice before jumping back to 174. The leg down from that high found support at slightly lower levels than before, then rallied again to 147 before dropping to its recent low at 126.
The support and resistance lines connecting these highs and lows mark the upper and lower boundaries of the wedge. Last week XLY managed to break out of that wedge to the upside, and it is getting a good follow-up so far this week, with XLY taking out the previous high(s) at 147.
Based on the theoretical target price XLY now has more upside potential to levels around 174, which is the highest point in the formation.
#StayAlert, –Julius
Julius de Kempenaer
Senior Technical Analyst, StockCharts.com
Creator, Relative Rotation Graphs
Founder, RRG Research
Host of: Sector Spotlight
Please find my handles for social media channels under the Bio below.
Feedback, comments or questions are welcome at Juliusdk@stockcharts.com. I cannot promise to respond to each and every message, but I will certainly read them and, where reasonably possible, use the feedback and comments or answer questions.
To discuss RRG with me on S.C.A.N., tag me using the handle Julius_RRG.
RRG, Relative Rotation Graphs, JdK RS-Ratio, and JdK RS-Momentum are registered trademarks of RRG Research.