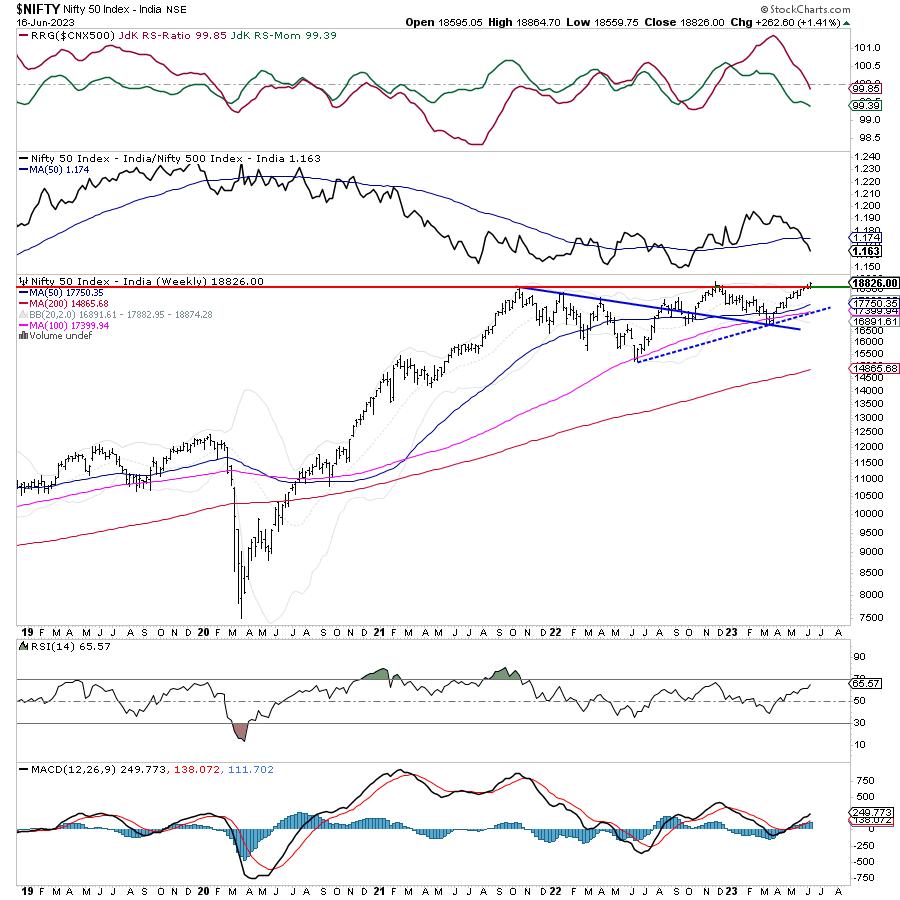
In what can be called a fairly buoyant week of trade, NIFTY moved towards its previous high point and closed at its lifetime high. The financials, though, represented by BankNifty (Nifty Bank) relatively underperformed, as the BankNifty Index closed on a flat note. The trading range for the markets remained decent; NIFTY oscillated in a 304.95-point range during the last five sessions. The coming week will be crucial, as we may see the NIFTY testing the previous high point of 18887; at the same time, it would be crucial to see if we can achieve a long-awaited breakout. The NIFTY has ended the week with a net gain of 262.60 points (+1.41%) on a weekly basis.
While the NIFTY stares at a potential breakout, there are a couple of very important things that we need to keep in mind, and also not get carried away by the kind of up move that we saw in the previous session. Friday was a day when there was a FTSE and Sensex rebalance, and that was to result in significant net inflows for the Indian markets. If we discount this, then we must not forget that we are rallying on a weak market breadth, and, with VIX, that has closed to a new low which is in striking distance to the 2019 lows. With each up move that we see, if these two factors are not getting corrected, then we are traveling a weak rally and this is what we need to keep in our minds.
FOMC is out of the way; ECB raises the rates. Both ECB and FOMC have spoken their minds. Expect the start of the week on a very quiet note. The levels of 19000 and 19230 are likely to act as strong resistance for the markets. The supports are likely to come in lower at the 18600 and 18480 levels.
The weekly RSI is 65.57; it has made a fresh 14-period high, which is bullish. It, however, stays neutral and does not show any divergence against the price. The weekly MACD is bullish and stays above the signal line.
The pattern analysis suggests that there is a serious divergence between the performance of NIFTY against BankNifty and the Financial Services index where the latter are relatively underperforming. Furthermore, another anomaly is the relative underperformance of the NIFTY against the broader NIFTY 500 index. All these factors need to get corrected if we are to see any strong and sustainable breakout from the current levels. The precariously low levels of VIX continue to leave the markets vulnerable to profit-taking bouts from higher levels.
The defensive mood was evident even in Friday’s session as the market breadth was evidently weak. The only two sectors that had a strong breadth were the defensive ones; FMCG and Pharma. All in all, as we chase and follow the rally, we will continue to stay highly vigilant at current levels. While being extremely mindful in giving priority to booking and protecting profits at higher levels, we should keep all new purchases extremely selective. And while continuing to keep leveraged positions at modest levels unless a sustainable directional bias is achieved, a cautious outlook is advised for the coming week.
Sector Analysis for the Coming Week
In our look at Relative Rotation Graphs®, we compared various sectors against CNX500 (NIFTY 500 Index), which represents over 95% of the free float market cap of all the stocks listed.

The analysis of Relative Rotation Graphs (RRG) shows NIFTY Auto, Consumption, Midcap 100, and Realty indices placed inside the leading quadrant. We will continue seeing these groups relatively outperforming the broader NIFTY 500 index.
The NIFTY FMCG, Financial Services, BankNifty, Infrastructure, and PSE sectors are inside the weakening quadrant. Individual shows from the components of these groups is likely, but they may continue to show weak relative performance.
The PSU Bank index is inside the lagging quadrant. However, it shows improvement in its relative momentum against the broader markets. The NIFTY IT, Commodities, and Services sector indices continue to languish inside the lagging quadrant.
The NIFTY Metal, Energy, and Media indices are inside the improving quadrant. The Media Index, out of these three, appears weaker, as it is giving up on its relative momentum against the broader markets.
Important Note: RRG™ charts show the relative strength and momentum of a group of stocks. In the above chart, they show relative performance against NIFTY500 Index (Broader Markets) and should not be used directly as buy or sell signals.
Milan Vaishnav, CMT, MSTA
Consulting Technical Analyst