In the previous technical note, it was categorically mentioned that, given the unabated upmove, the markets have risen near-vertically. This has caused the indices to deviate greatly from their mean, making them overextended and prone to violent profit-taking bouts. While weekly, the markets have just consolidated, but on the daily charts, they saw a strong profit-taking bout in the middle of the week. The index found itself having traded in a 616.20 point range. Following seven weeks of straight gains and a very choppy trade over the past five sessions, the headline index closed with a modest weekly loss of 107.25 points (-0.50%).
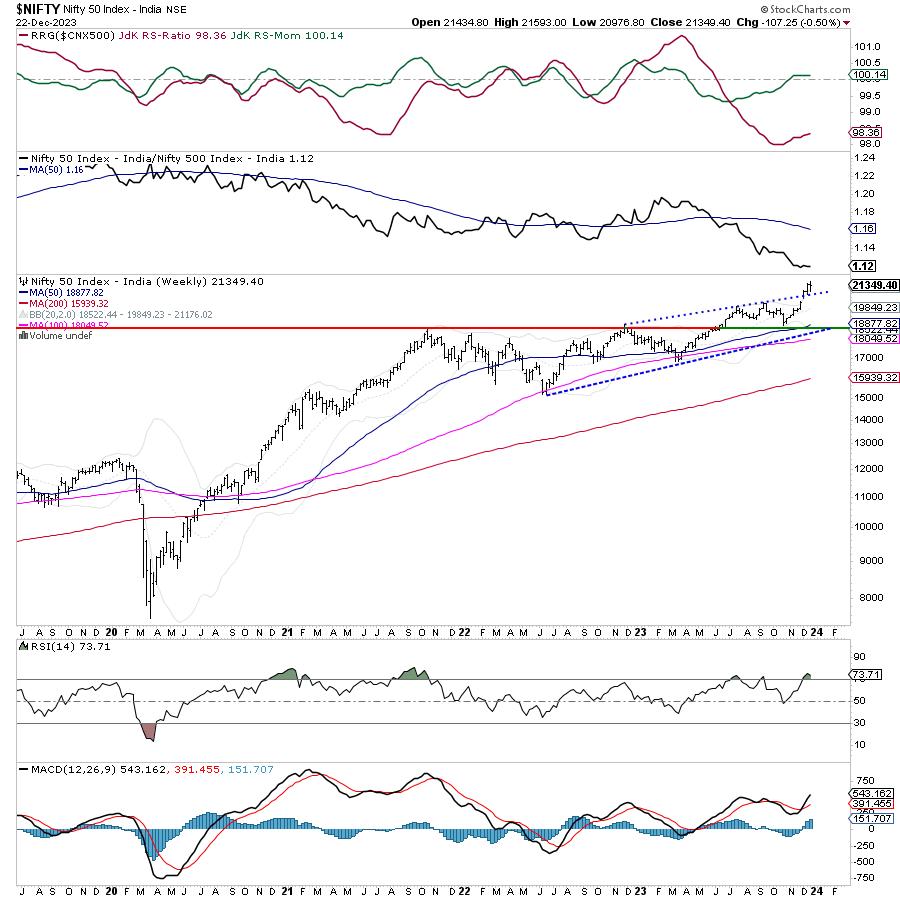
The coming week is a short week, with Monday being a holiday on account of Christmas. The month has stayed strong so far, with NIFTY gaining 6.04%; the coming week will see the week, month, as well year coming to a close. While we did see some jitters on the daily charts, on a weekly basis we continue to remain overextended as the markets have run much ahead of their curve. The 20-week MA remains 1500 points below while the 50-week MA stays as far as 2472 points below the current levels. This kind of steep deviation from the mean and staying overextended on the charts continues to leave the markets vulnerable to sharp and volatile profit-taking bouts from current, as well as higher, levels. Volatility spiked; INDIAVIX rose 4.42% to 13.71 on a weekly note.
The coming week will see the markets opening on a quiet note and may find themselves prone to some corrective pressure. The levels of 21490 and 21600 will act as immediate resistance points. The supports will come in at 21100 and 20950 levels.
The weekly RSI remains at 73.71; it has marked a new 14-period high, which is bullish. However, it is still in the overbought zone and neutral, while not showing any divergence against the price. The weekly MACD remains bullish while holding above its signal line.
A Spinning Top occurred on the candles. Such a formation is seen when there is little difference between the open and closed levels. This denotes the indecisive behavior of the market participants. Such formations can potentially mark a reversal; however, they need confirmation as well.
The pattern analysis on the weekly chart shows that the NIFTY has continued to stay above the rising channel after staging a breakout in the previous week. In the process, the Index has also dragged its resistance levels higher to 21000, going by the options data. So long as the index stays above the 21000 mark, it will just be within capped consolidation. However, any slip below 21000 shall make them incrementally weaker.
All in all, the method to approach the markets would be on similar lines. If the markets show any incremental upmove, more emphasis and focus would be needed to book and protect profits rather than making new purchases. The rallies need to be utilized to protect gains; all new purchases must be kept highly stock-specific and selective. While focusing more on the pockets that are showing improving relative strength, it would also be prudent to refrain from over-leveraged exposures. A highly cautious outlook is advised for the coming week.
Sector Analysis for the Coming Week
In our look at Relative Rotation Graphs®, we compared various sectors against CNX500 (NIFTY 500 Index), which represents over 95% of the free float market cap of all the stocks listed.
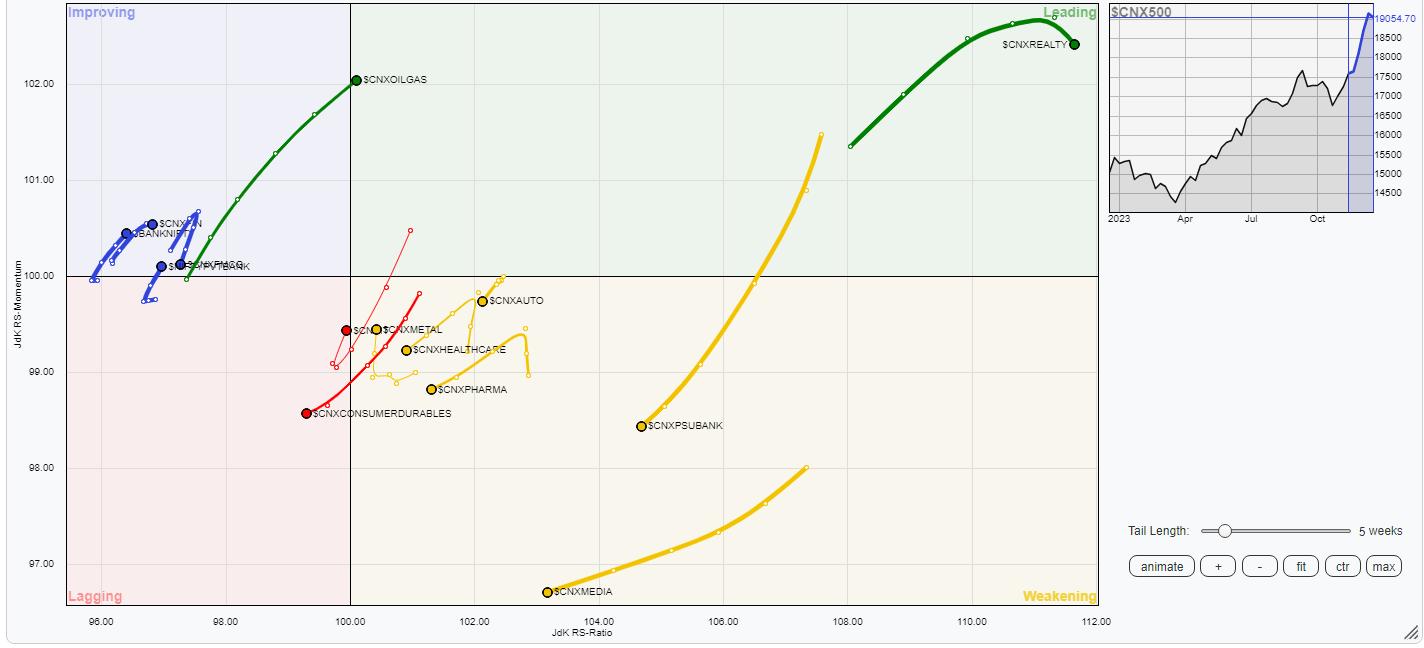
Relative Rotation Graphs (RRG) show a mixed setup, where many sectors are seen sharply giving up on their relative momentum while others are staying strong with their rotation. The leading quadrant has Nifty Commodities, Energy, Infrastructure, PSE, and Realty indices inside the leading quadrant, where they may continue to outperform the broader markets relatively.
While staying inside the weakening quadrant, the PSU Bank, Media, Pharma, Midcap 100, and Auto indices have continued to drift lower; the Metal Index has shown a sharp improvement in its relative momentum.
Though it has stayed inside the lagging quadrant, the IT Index has shown a sharp improvement in its relative momentum.
The FMCG and Consumption Indices are inside the improving quadrant; however, they are sharply giving up on their relative momentum. The BankNifty and Service Sector index remain inside the improving quadrant as well.
Important Note: RRG™ charts show the relative strength and momentum of a group of stocks. In the above chart, they show relative performance against NIFTY500 Index (Broader Markets) and should not be used directly as buy or sell signals.
Milan Vaishnav, CMT, MSTA
Consulting Technical Analyst
www.EquityResearch.asia | www.ChartWizard.ae