Following a strong consolidation in the week before this one, the markets finally staged a decisive rally over the past four sessions of the truncated week. The benchmark index NIFTY50 surged in all four sessions; it went on to move past the previous lifetime high of 20222.45 and managed to end at a fresh all-time high level. Amid high volatility, the trading range also got wider; the NIFTY moved in a range of 491.55 points through the week. While managing to maintain the gains, the headline index managed to close near its high point with net weekly gains of 473.20 points (+2.39%).
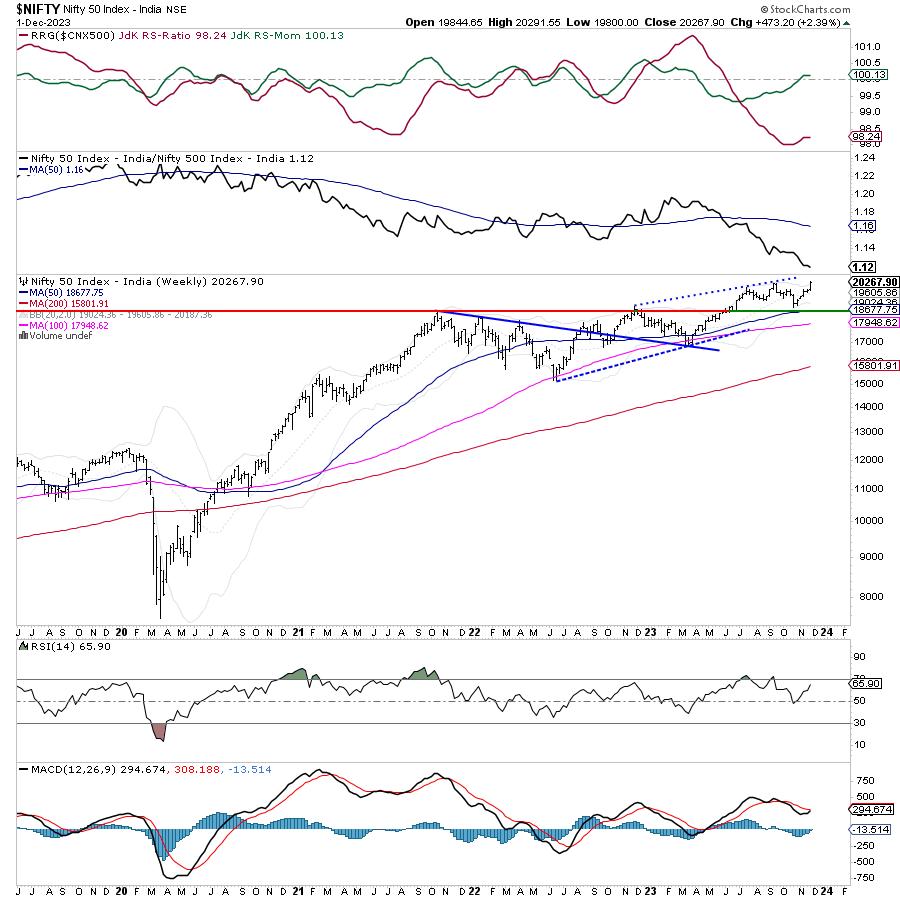
While the markets rose, so did the volatility. The volatility, as represented by INDIAVIX, surged 9.29% to 12.38 on a weekly basis. From a technical standpoint, the Index remains firmly on a rising trajectory. If it continues to advance within its defined and laid path, it may go on to test the upper edge of the rising channel which translates into the levels of 20500—20650 zone. The spikes in the volatility may turn the market choppy; however, there are greater of the breakout getting extended and the Index testing the upper edge of the rising channel. After that, some consolidation cannot be ruled out.
Monday is expected to see a positive and strong start to the week; the levels of 20400 and 20580 are likely to act as resistance. The supports come in at 20080 and 19900 levels.
The weekly RSI is 65.90; it has marked a fresh 14-period high which is bullish. It stays neutral and does not show any divergence against the price. The weekly MACD is bearish and below its signal line; however, it looks on the verge of a positive crossover.
The NIFTY has closed above the upper Bollinger band. Even if it temporarily pulls itself back inside the band, it has laid a strong foundation for a sustainable breakout taking place. This setup has further increased the possibilities of the NIFTY testing the upper edge of the rising channel as mentioned above.
The pattern analysis of the weekly charts lays out a simple picture. The markets suffered a full throwback and this led to the NIFTY retesting the original breakout zone of 18900-18950. Very much on the expected lines, this zone acted as a potent support and the NIFTY not only rebounded but went on to form a fresh lifetime high. It is expected that the Index may go on and test the upper edge of the rising channel while attempting to test the 20500-20650 zone.
All and all, the larger setup looks evidently buoyant; there are greater possibility of the markets extending their breakout. However, over the coming week, we will also see some sector rotation taking place with money moving more into relatively defensive pockets like FMCG, Consumption, Pharma, etc., while the PSE space may continue doing well. It is strongly recommended to chase the right group of stocks while focusing on the stocks that are enjoying greater relative strength. An equal amount of emphasis should also be kept on protecting profits at higher levels.
Sector Analysis for the coming week
In our look at Relative Rotation Graphs®, we compared various sectors against CNX500 (NIFTY 500 Index), which represents over 95% of the free float market cap of all the stocks listed.
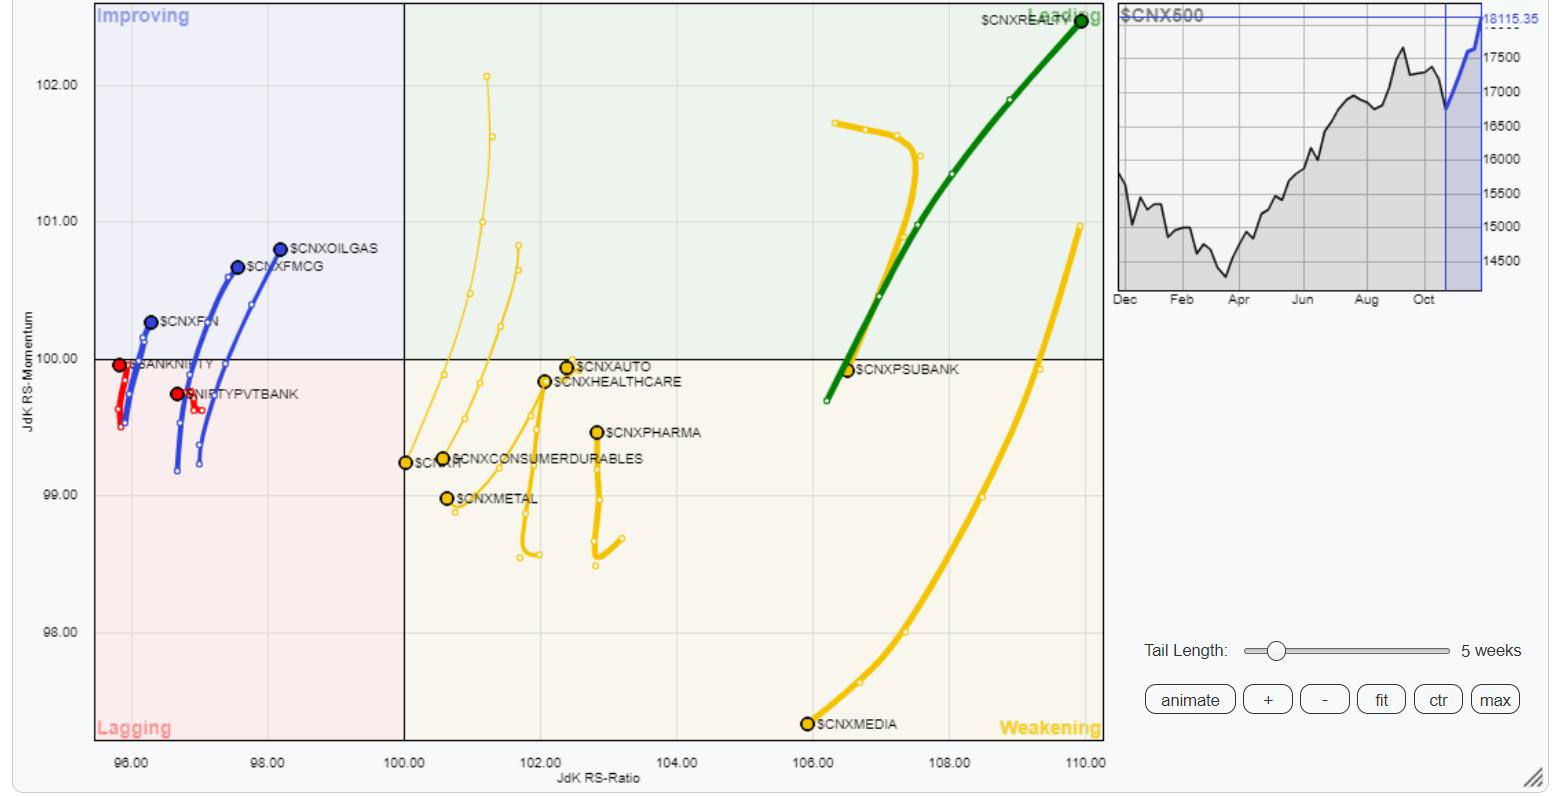
Relative Rotation Graphs (RRG) show a similar kind of setup that was seen over the previous week. We have Nifty Realty, PSE, Infrastructure, Commodities, and Energy Indices inside the leading quadrant. These groups are expected to relatively outperform the broader markets.
The PSU Bank Index has rolled inside the weakening quadrant. This may see this space start to weaken its relative performance. Besides this, the Metal, Media, Pharma, IT, Auto, and Midcap indices are inside the weakening quadrant. Among these, the Metal, Auto, and Pharma groups are seen improving on their relative momentum.
Besides Nifty Bank, none of the Indices are inside the lagging quadrant. This space may struggle a bit so far as relative performance is concerned.
Nifty FMCG, Consumption, Services Sector, and Financial Services indices are placed inside the improving quadrant.
Important Note: RRG™ charts show the relative strength and momentum of a group of stocks. In the above Chart, they show relative performance against NIFTY500 Index (Broader Markets) and should not be used directly as buy or sell signals.
Milan Vaishnav, CMT, MSTA
Consulting Technical Analyst
www.EquityResearch.asia | www.ChartWizard.ae