Continuing with the unabated upmove, the markets went on to post their fresh lifetime highs once again; Nifty has ended on a fresh lifetime high on a closing basis as well. The rally this week was propelled by the Fed which kept the interest rates unchanged. While this was widely expected, what made the markets react so strongly was the commentary by the Fed that hinted at three rate cuts in the coming year. The Nifty traded in a wide trading range; it oscillated in a wide 722.80 points range before ending the seventh consecutive week of gains. The headline index has closed posting a strong weekly gain of 487.25 points (+2.32%).
Markets are in uncharted territory. Over the last two sessions, Nifty has surged over 500 points. In this month, Nifty has risen over 1323 points (+6.57%) in December so far. Given this kind of gains, the index is trading overbought on both daily and weekly charts. Getting and staying overbought is a good sign as that shows strength in the upmove; securities and indices tend to stay overbought for long when they are witnessing a strong uptrend. The worrying factor is the near-vertical manner in which the markets have risen and the extent to which they remain over-extended.
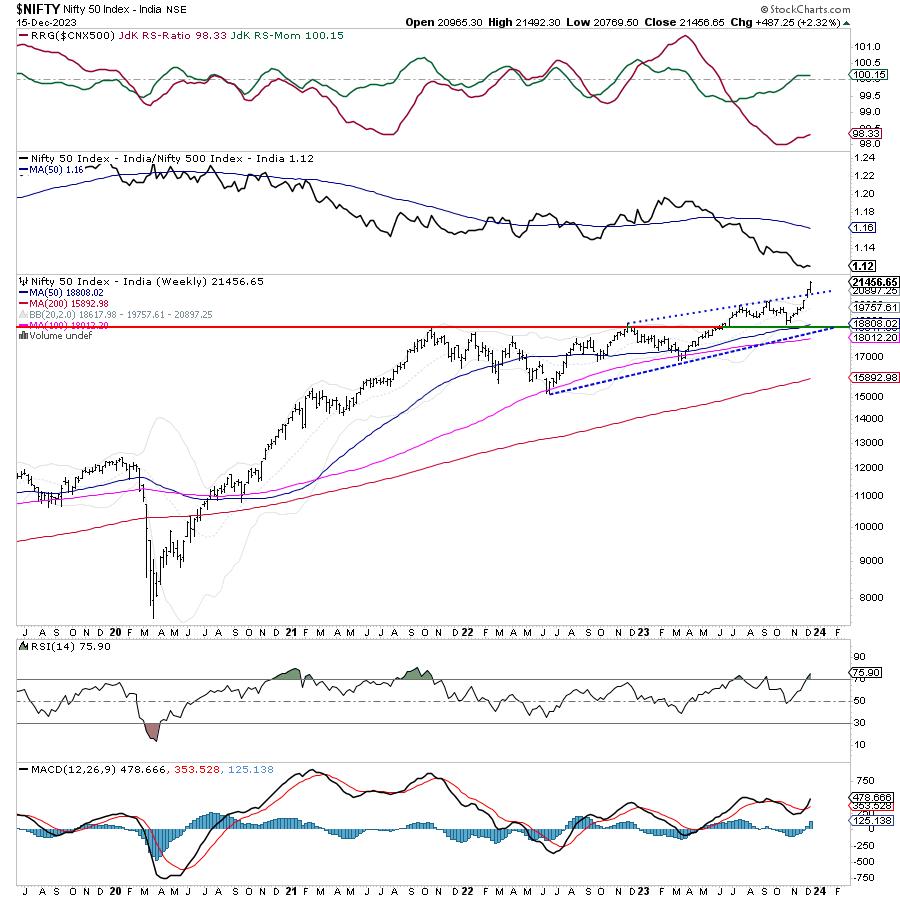
The index has run up much ahead of its curve. The short-term 20-week MA is almost 1700 points below the current levels at 19757. The 50-week MA which is widely used to determine the primary trend is placed at 18808 which is over 2600 points from current levels. This makes the current setup extremely dangerous and prone to violent profit-taking bouts if the markets do not take a breather and consolidate. Even the smallest profit-taking has room for a decent retracement from the current levels.
Monday is likely to see the markets staying tentative at higher levels; the levels of 21540 and 21750 are expected to act as resistance levels. The supports come in much lower at 21100 and 20850 levels.
The weekly RSI stands at 75.90; it has made a fresh 14-period high. However, it stays neutral and does not show any divergence against the price. The weekly MACD stays bullish and above its signal line. The price has closed above the upper Bollinger band; however, while this can be considered bullish, a temporary pullback inside the band cannot be ruled out.
The pattern analysis of the weekly chart shows that the Nifty has staged a strong breakout from a rising channel; at present, the index has ended the second week in a row with gains post the breakout, and in total, it has ended the seventh consecutive week with gains. That being said, while the index has dragged its supports higher than before, they remain significantly lower as the Index has run too much ahead of its curve, and possibilities of retracement or measured consolidation from the current levels cannot be ruled out.
All in all, given the kind of extent to which the markets have drifted away from their mean, it is time to get prudent and stop blindly chasing the markets. Instead, the prudent way to utilize every upmove that we get from here is to protect profits on those stocks that are returning decent gains and move to the stocks that are defensive and are showing renewed relative strength. While staying highly cautious and buying very selectively, the current technical setup also warrants an equal amount of attention to protecting profits at current and higher levels. A highly cautious outlook is advised for the coming week.
Sector Analysis for the coming week
In our look at Relative Rotation Graphs®, we compared various sectors against CNX500 (NIFTY 500 Index), which represents over 95% of the free float market cap of all the stocks listed.
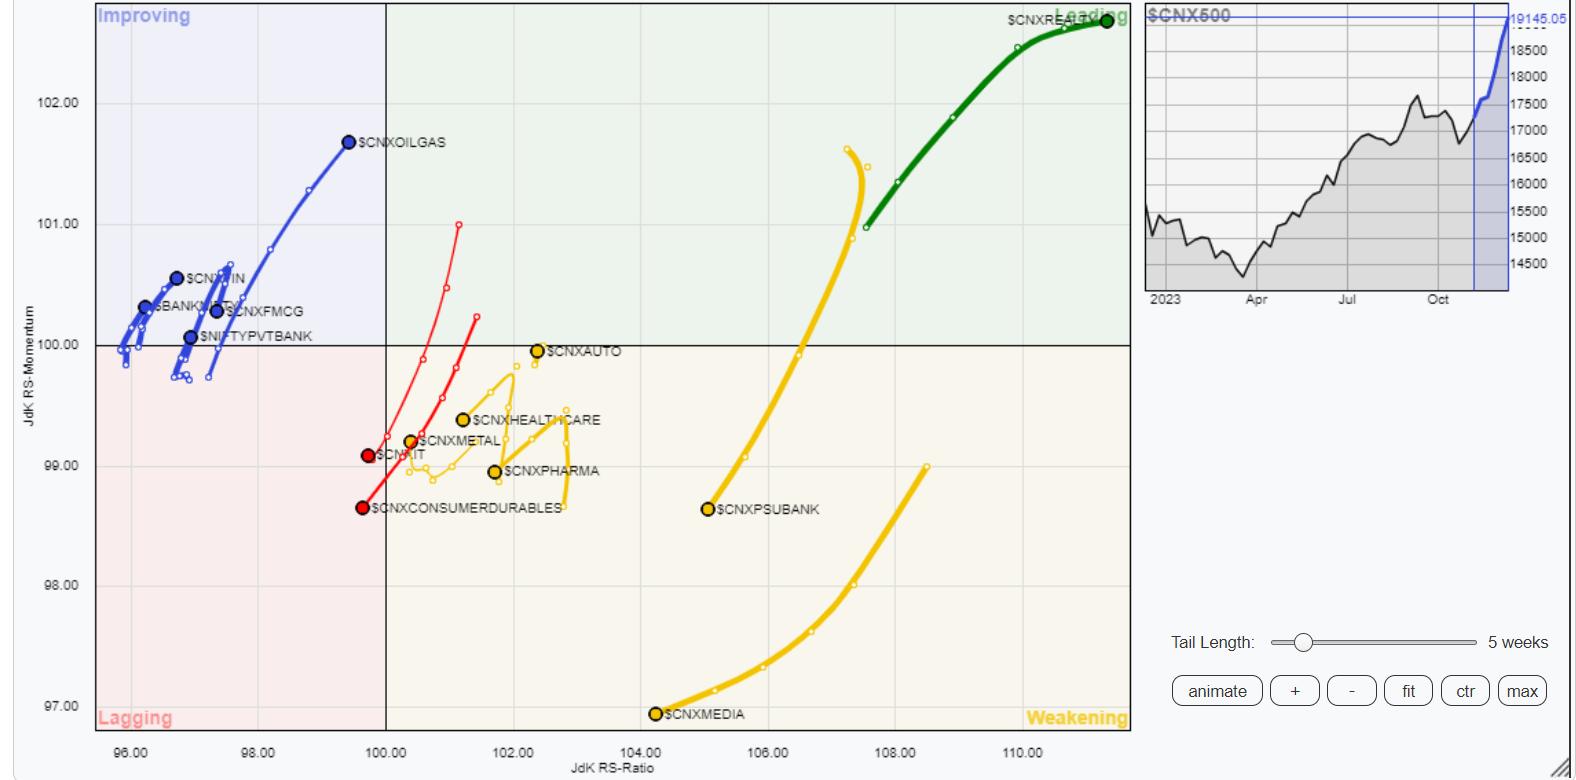
Relative Rotation Graphs (RRG) show that the Nifty Energy, Commodity, Realty, PSE, and Infrastructure indices stay well-placed inside the leading quadrant. These groups will continue to relatively outperform the broader markets.
The PSU Bank, Pharma, Midcap 100, Metal, and Media indices are inside the weakening quadrant. They may continue to individually perform but may end up slowing down on their relative performance.
Despite a strong move, the IT Index remains inside the lagging quadrant; however, it is seen improving on its relative momentum against the broader markets.
Banknifty is inside the improving quadrant along with the Services Sector Index. The FMCG and Consumption indices are also inside the improving quadrant but they are seen losing their relative momentum against the broader markets.
Important Note: RRG™ charts show the relative strength and momentum of a group of stocks. In the above Chart, they show relative performance against NIFTY500 Index (Broader Markets) and should not be used directly as buy or sell signals.
Milan Vaishnav, CMT, MSTA
Consulting Technical Analyst
www.EquityResearch.asia | www.ChartWizard.ae