The previous week was reduced to just a short 3-day trading week as Monday was declared a special holiday while on Friday, the markets remained shut on account of Republic Day. Despite this, the markets remained extremely choppy and traded in a much wider range as they continued to decline for the second week in a row. The week-on-week change may look normal but during these three days, the Nifty witnessed wide-ranging moves with spikes in volatility. During the past three sessions, the index oscillated in a wide 613.05 points range. While continuing to retrace, the headline index closed with a net loss of 269.80 points (-1.25%).
As we step into the new week, the markets face one of the most important external domestic events, i.e., the Union Budget slated to be presented on the 1st of February. However, it is important to understand and note that due to General Elections scheduled later this year, the Government will not present a full-fledged Union Budget but a “Vote-on-Account”. Once the elections are done away with, the Government usually comes up again with a full budget. Despite this technicality, the markets will continue to react in a very volatile way. The volatility will be even more as the 1st falls on Thursday which is also a weekly options expiry day for Nifty. Overall, going by the F&O data, the markets have dragged their resistance levels lower to 21700; so long as the Nifty is below this point, no runaway rallies are expected.
Further to this, there are strong possibilities that the markets remain choppy throughout this week; a sharp directional bias is expected to emerge post-Thursday once the external event of Vote-on-Account is out of the way. The coming week is likely to see the levels of 21500 and 25750 acting as resistance while supports are expected to come in at 21100 and 20950 levels. The trading range is expected to stay wider than usual.
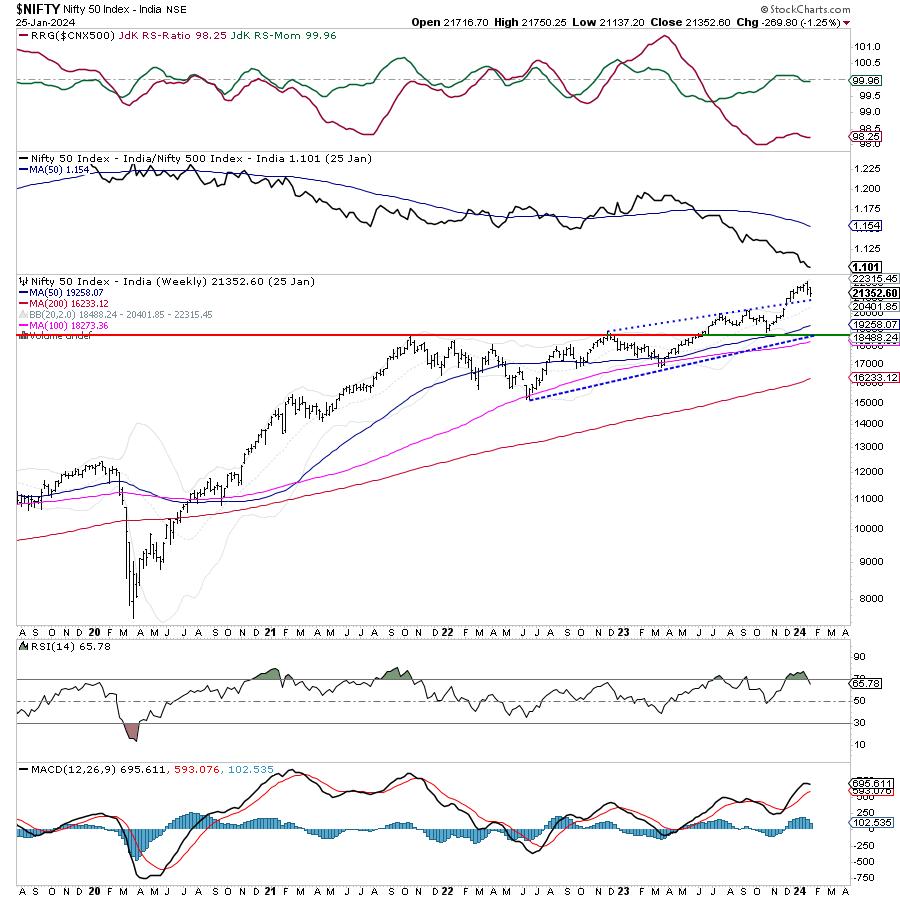
The weekly RSI stands at 65.78; it has crossed under 70 from the overbought area which is bearish. It stays neutral and does not show any divergence against the price. The weekly MACD stays bullish and above its signal line.
The pattern analysis on the weekly chart shows that following a breakout from a rising channel from 20800 levels, NIFTY went on to form a high point at 22124. Subsequently, it has seen a retracement and the nearest pattern support rests near 20900-21000 in the form of the trend line of the rising channel which it crossed earlier. This prior resistance is now expected to be the nearest pattern support for the markets.
Over the coming days, it is strongly recommended to avoid highly leveraged exposures in the markets as the volatility is expected to spike as we go near the event day. This may cause sharp moves by the markets on either side; the stop losses on either side are likely to get triggered frequently. On the other hand, we will see defensive pockets like IT, Pharma, etc., doing well. It is also expected that the Metal stocks in general and PSE stocks, in particular, may do well during the run-up to the event. It is strongly recommended to adopt a highly selective approach to the markets. While staying stock-specific while making new purchases, the exposures should also be kept at modest levels.
Sector Analysis for the coming week
In our look at Relative Rotation Graphs®, we compared various sectors against CNX500 (NIFTY 500 Index), which represents over 95% of the free float market cap of all the stocks listed.
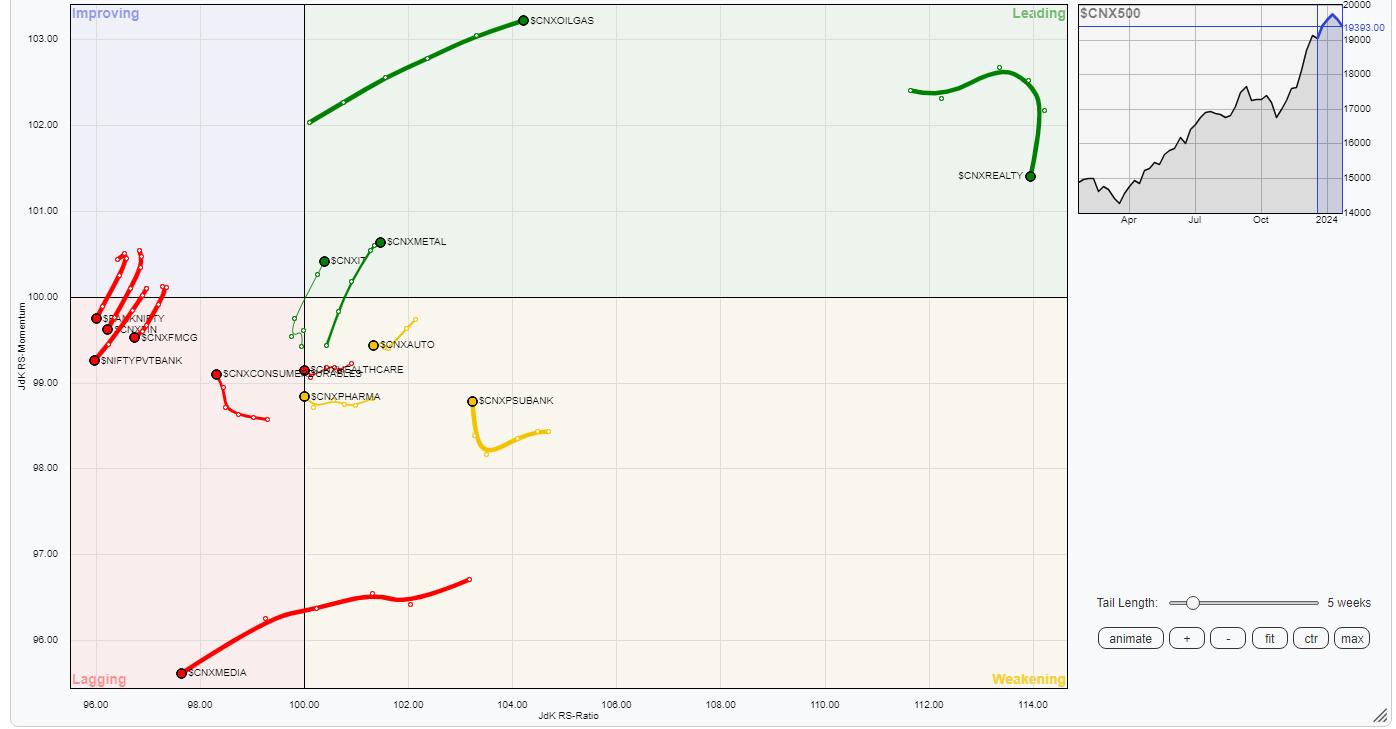
Relative Rotation Graphs (RRG) Nifty Metal, Infrastructure, PSE, Commodities, and Energy Sectors are placed inside the leading quadrant. These sectors are joined by the IT Index which has also rolled inside the leading quadrant. Collectively, these groups will relatively outperform the broader markets. The Realty Index is also inside the leading quadrant; however, it is seen slowing down and giving up on its relative momentum.
The Midcap 100, Auto, and Pharma groups are inside the weakening quadrant. The PSU Bank Index is also inside the weakening quadrant but it is seen sharply improving on its relative momentum against the broader markets.
The Media Index continues to languish inside the lagging quadrant. The Nifty Bank index has also rolled inside the lagging quadrant. These groups, along with Nifty Financial Services, FMCG, and Consumption which are also inside the lagging quadrant are expected to relatively underperform the broader Nifty 500 index.
The Nifty Services Sector index is the only one inside the improving quadrant; however, it also appears to be giving up on its relative momentum.
Important Note: RRG™ charts show the relative strength and momentum of a group of stocks. In the above Chart, they show relative performance against NIFTY500 Index (Broader Markets) and should not be used directly as buy or sell signals.
Milan Vaishnav, CMT, MSTA
Consulting Technical Analyst
www.EquityResearch.asia | www.ChartWizard.ae