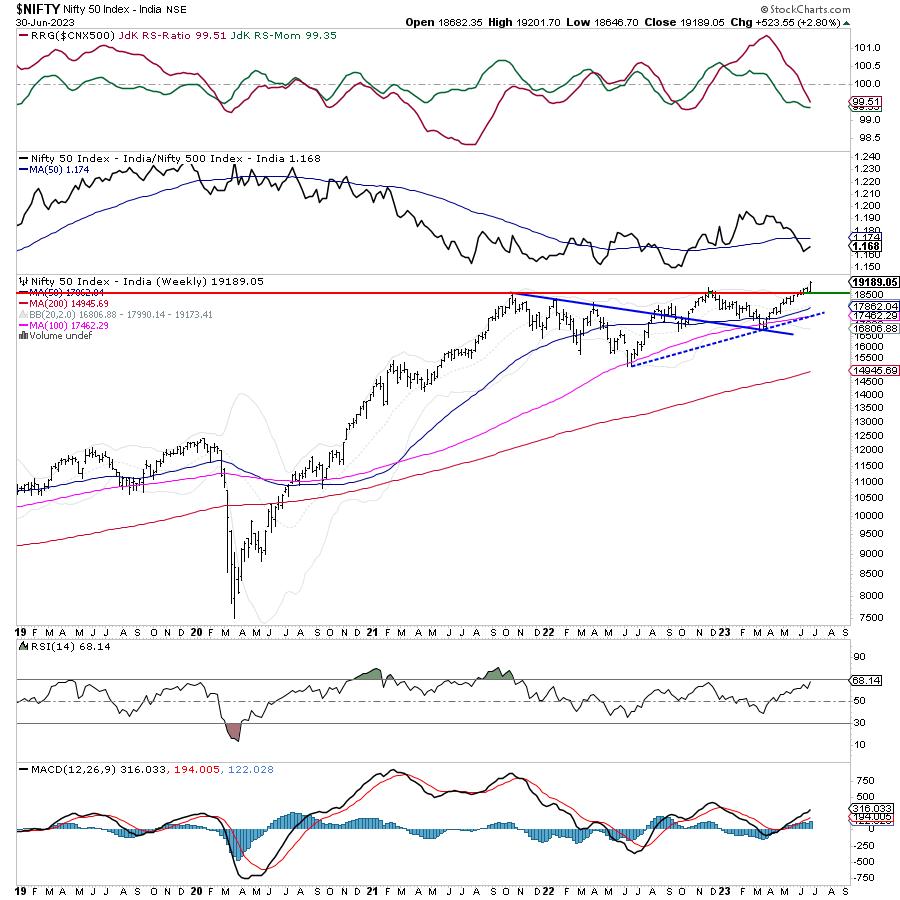
After testing the prior top of 18887 multiple times during the last five sessions, the Indian equity markets finally attempted a long-awaited breakout by moving past this point and closing near the high point of the week. While the market breadth improved a bit, the volatility continued to remain near one of its lowest points. The trading range got wider, as the NIFTY moved in a 555-point range. The financial space continued to relatively underperform the frontline NIFTY. The headline index closed on a strong note, with a net gain of 523.55 points (+2.80%) on a weekly basis. The month ended as well; NIFTY closed with a net monthly gain of 654.65 points (+3.53%).
Until now, the banking and financial space was seen as grossly underperforming the NIFTY. BankNifty, too, ended on a strong note and remains on a verge of a breakout. For a sustainable breakout to take place, this key index needs to confirm with NIFTY and attempt a breakout. The NIFTY Index, in the process, has dragged its support higher to 19000, going by the derivatives data. In the event of any consolidation, this level is likely to provide support. The volatility continued to remain low; the INDIAVIX came off by 3.87% to 10.80, which can be considered as one of the lowest points seen in recent years. This makes it near-mandatory for participants to stay extremely vigilant and protect profits at current levels.
Monday may see the week starting on a positive note; for the breakout to get confirmed, it would be crucial for the NIFTY not to slip below 18900 levels. The coming week is likely to see the levels of 19280 and 19400 acting as resistance points; the supports are likely to come in at the 18900 and 18680 levels. The trading range is likely to stay wider than usual; the index is also now trading in uncharted territory.
The weekly RSI is 68.14; it remains neutral and does not show any divergence against the price. The weekly MACD is positive and trades above its signal line.
The pattern analysis of the weekly chart shows that the NIFTY has finally attempted a breakout by moving past and closing above the prior top of 18887. With this level, which had served as resistance earlier, taken out, it is expected to now act as support in the event of any consolidation from current levels. The derivatives data also shows maximum PUT OI built up at 19000; this makes the zone of 18900-19000 the immediate support area for the markets. NIFTY will have to stay above this point to be able to confirm and extend the current breakout.
If the upside extends itself, we will see some relative outperformance from high-beta pockets. This would include banks, auto, and energy, and would also see pockets like IT and Pharma doing as well. It is strongly recommended to not only remain stock-specific while chasing the up move, but it would also be prudent to remain equally vigilant in protecting profits at higher levels. A positive outlook is advised for the day.
Sector Analysis for the Coming Week
In our look at Relative Rotation Graphs®, we compared various sectors against CNX500 (NIFTY 500 Index), which represents over 95% of the free float market cap of all the stocks listed.
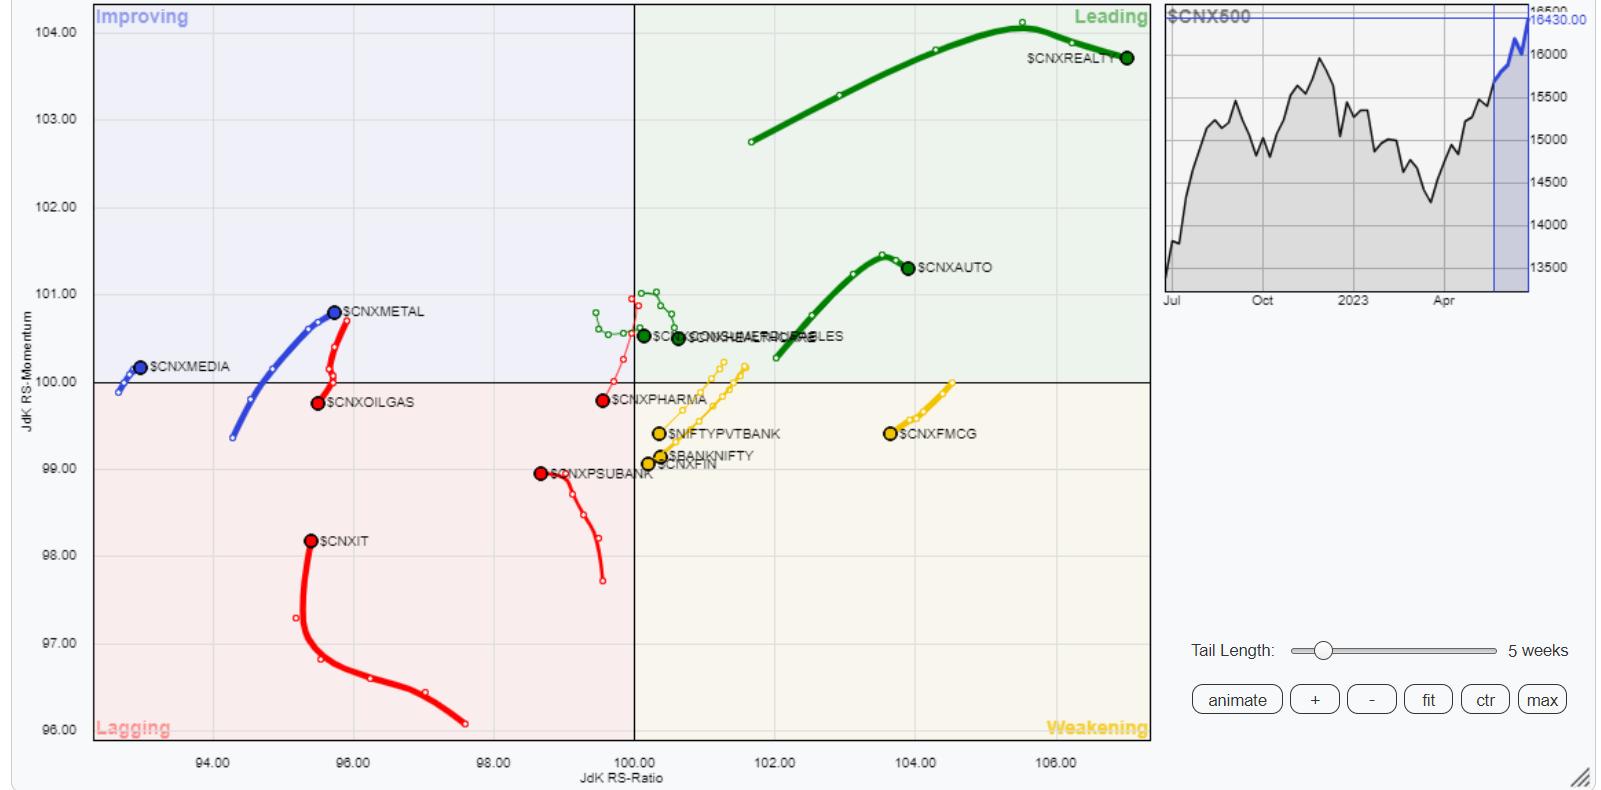
The analysis of Relative Rotation Graphs (RRG) shows Realty, Auto, Consumption, and MidCap 100 index inside the leading quadrant. We will continue seeing these groups relatively outperforming the broader markets.
Nifty FMCG, Financial Services, PSE, and BankNifty remain inside the weakening quadrant; they show no signs of any improvement in their relative momentum against the broader NIFTY 500 index. The Infrastructure index is also inside the weakening quadrant; however, it is seen improving in its relative momentum.
The Nifty Pharma Index has rolled inside the weakening quadrant. The PSU Bank, Services Sector, and Commodities indices continue to languish inside the lagging quadrant. The IT Index is also inside the lagging quadrant but it is showing strong improvement in its relative momentum.
Energy Index is seen losing its momentum while staying inside the improving quadrant. Nifty Metal and Media indices are comfortably placed inside the improving quadrant.
Important Note: RRG™ charts show the relative strength and momentum of a group of stocks. In the above Chart, they show relative performance against NIFTY500 Index (Broader Markets) and should not be used directly as buy or sell signals.
Milan Vaishnav, CMT, MSTA
Consulting Technical Analyst