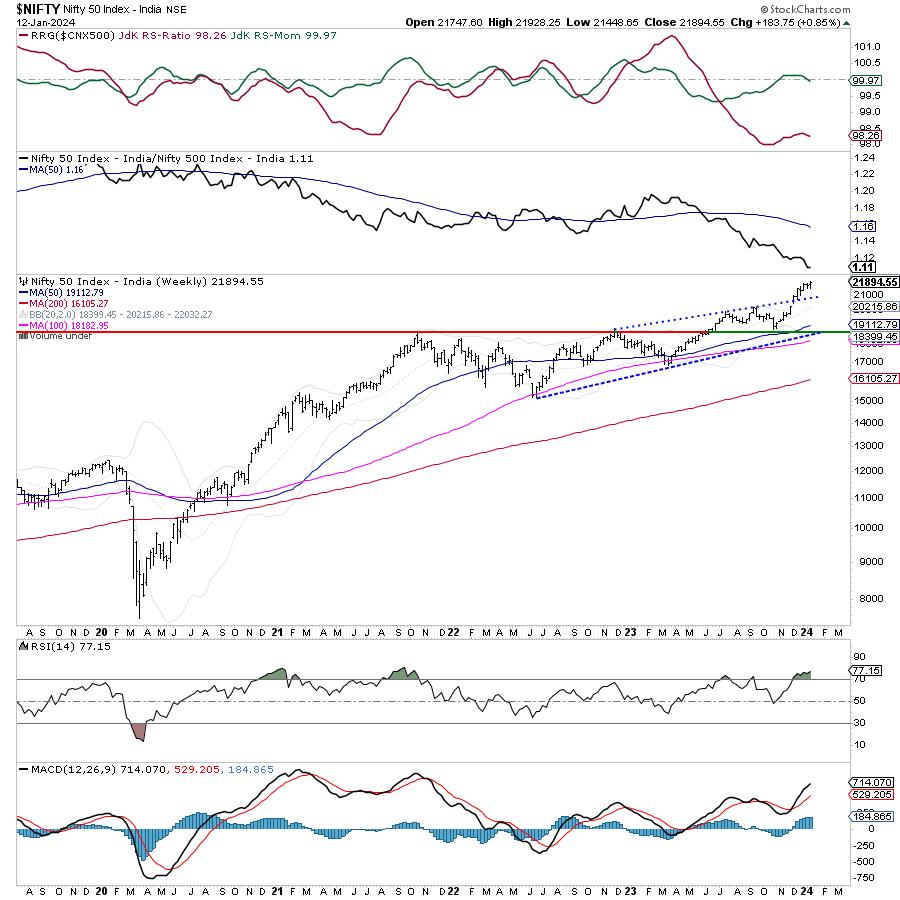
After consolidating for most of the week, the markets extended their upmove and ended at yet another record lifetime high. In the past four out of five sessions, the markets were seen consolidating and staying under limited corrective retracement. However, they did find themselves taking support at the short-term 20-Day MA and rebounded from there. On a weekly basis, while the markets consolidated in the previous week, this time, they inched higher. The trading range also widened; the index oscillated in a 479.60 points range over the past five days. Finally, the benchmark index closed with a net gain of 183.75 points (+0.85%).
From a technical standpoint, the markets are once again at a crucial juncture. The Options data suggest that the markets may have opened up some more room for themselves on the upside. However, the overall structure of the charts also suggests that the Index is highly overextended and continues to remain prone and vulnerable to profit-taking bouts from current levels. With the ongoing trend staying strong, the only method to approach such markets is to keep trading/following the trend while effectively trailing the stop-losses higher. Volatility also inched higher; India Vix rose by 3.72% to 13.10.
The coming week is likely to see a stable start as the markets enter uncharted territory once again. Expect the levels of 21950 and 22185 to act as potential resistance. The supports exist at 21745 and 21580 levels.
The weekly RSI stands at 77.15; it remains mildly overbought. The RSI has also formed a new 14-period high but stays neutral without showing any divergence against the price. The weekly MACD is bullish and remains above its signal line.
A candle with a long lower shadow has emerged. The prior candle to this was a spinning top or a Doji. Such candles after a sustained upmove continue to hold the potential of stalling the trend at any point in time. However, in the same breadth, candles are never traded in isolation and one must always look out for confirmation.
The pattern analysis on the weekly charts shows that the Nifty continues to extend its breakout. The index had broken out from a rising channel when it crossed above 20800 levels. This breakout continues to take the markets higher; however, at the same time, the Nifty remains heavily overextended on charts. The nearest pattern support stands at 21000, the 20-week MA is 1679 points below the current levels at 20215. The 50-week MA is at 19112; a good 2792 points from the current levels. With the nearest pattern supports standing at almost 900 points from the current levels, any mean reverting moves shall be significant to their extent.
All in all, the method to approach the markets from now on is pretty much simple. There is no question of shorting the markets or going against the trend. However, given the over-extended nature of the markets, it is of paramount importance that one keeps trailing their stoplosses effectively in the manner that the major portion of the profits stand protected. New purchases must be kept defensive; it is expected that sectors like FMCG, Pharma, etc., may do well going ahead from here. While keeping leveraged exposures under control, a highly selective approach is advised for the day.
Sector Analysis for the coming week
In our look at Relative Rotation Graphs®, we compared various sectors against CNX500 (NIFTY 500 Index), which represents over 95% of the free float market cap of all the stocks listed.
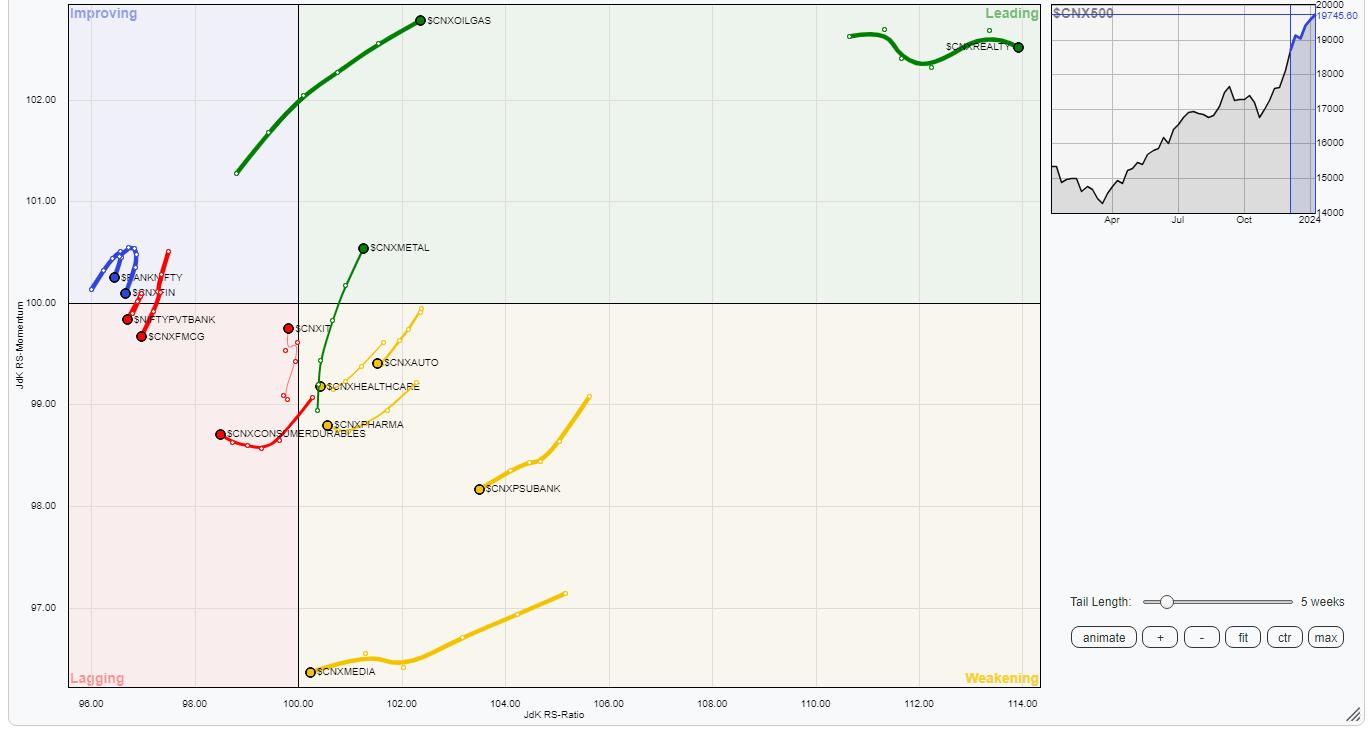
Relative Rotation Graphs (RRG) shows Nifty Energy, Commodities, Realty, PSE, and Metal Index firmly placed inside the leading quadrant. The Infrastructure Index is also inside the leading quadrant. These groups are likely to continue to relatively outperform the broader markets.
The Nifty Media, PSU Bank, Pharma, and Auto Indices continue to drag while staying inside the weakening quadrant. Though individual performances from these groups may be seen, the relative performance may take the back seat. The MidCap 100 index shows good improvement in its relative momentum while staying inside the weakening quadrant.
The IT Index shows sharp improvement in its relative momentum while staying inside the lagging quadrant. On the other hand, Nifty Consumption and FMCG has rolled inside the lagging quadrant given their relative underperformance against the broader markets.
The Nifty Bank and Services Sector index are inside the improving quadrant; however, they appear to be giving up on their relative momentum.
Important Note: RRG™ charts show the relative strength and momentum of a group of stocks. In the above Chart, they show relative performance against NIFTY500 Index (Broader Markets) and should not be used directly as buy or sell signals.
Milan Vaishnav, CMT, MSTA
Consulting Technical Analyst
www.EquityResearch.asia | www.ChartWizard.ae