In the previous technical note, it was mentioned that the markets are prone to some consolidation and corrective retracements due to the technical setup on the charts. It was also mentioned that the precariously low levels of volatility need to be watched, and this also can keep the markets vulnerable to sharp profit-taking bouts from higher levels. While trading in line with this analysis, the past four out of five sessions saw the market going through corrective declines. The trading range also widened on the expected lines; the Nifty oscillated in a 537-point range over the past week. The headline index closed negative, losing 518.10 points(-2.57%) on a weekly basis.
The monthly derivatives expiry is slated to come up next week; the coming sessions are likely to stay influenced by rollover-centric activities. The level of 20,200 has now become an intermediate top for the Nifty; so long as this level is not taken out comprehensively, the markets will remain under consolidation and may even see minor corrective retracements. The index is at a support level of 50 DMA on the daily charts and may see a short-term technical rebound, but on the higher time frame charts, the index remains vulnerable to some more profit-taking bouts and corrective retracements. Despite the corrective decline, the volatility index, represented by India VIX, did not rise. In fact, it declined marginally by 2.20% to 10.66 on a weekly basis. This continues to keep the markets vulnerable to incremental corrective retrenchments.
The coming week may see a tentative start to the trade; the levels of 19850 and 19990 will potentially act as resistance for the market. The supports may come in at 19500 and 19380 levels.
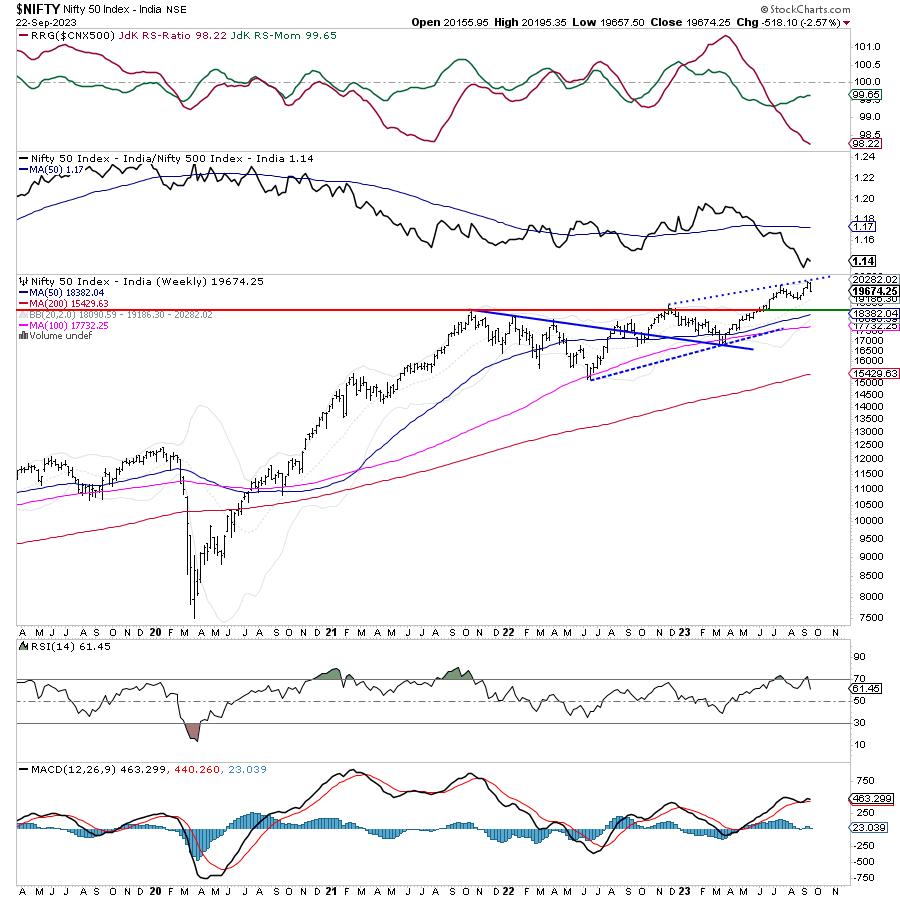
The weekly relative strength index (RSI) is at 61.45; it shows a mild bearish divergence against the price. While the price made a higher high, the RSI did not, and this led to the development of a bearish divergence of RSI against the price. The weekly Moving Average Convergence/Divergence (MACD) is bullish and above the signal line. However, the narrowing histogram shows that this indicator may show a negative crossover in the coming weeks. A large black candle emerged; the occurrence of such a candle following a significant uptrend has the potential to disrupt the current rally, and this may lead to the formation of a potential intermediate top.
The pattern analysis of the weekly charts shows that the Nifty 50 index trades above all key moving averages; however, it has resisted the upward-rising trend line. This upward rising trend line begins from 18,900 and joins the subsequent higher tops at 19,990 and 20,200 levels. This means that until and unless the most immediate high of 20,200 is not taken out comprehensively, we will find all upsides finding resistance near this level.
All in all, some defensive setup is also likely to become visible in the markets. We are unlikely to see any sector-specific dominance, but we may see highly selective and stock-specific performance coming in from different sectors. There are higher possibilities that defensive pockets like IT, pharma, PSU banks, and low beta sectors like PSE also do well. Although some short-term technical rebounds cannot be ruled out, any continued corrective retrenchment will have the potential to take the markets back to the breakout point of 19,000 levels, and if this happens, it should not come as a surprise to us. The cautious outlook is advised for the coming week.
Sector Analysis for the coming week
In our look at Relative Rotation Graphs®, we compared various sectors against CNX500 (NIFTY 500 Index), which represents over 95% of the free float market cap of all the stocks listed.
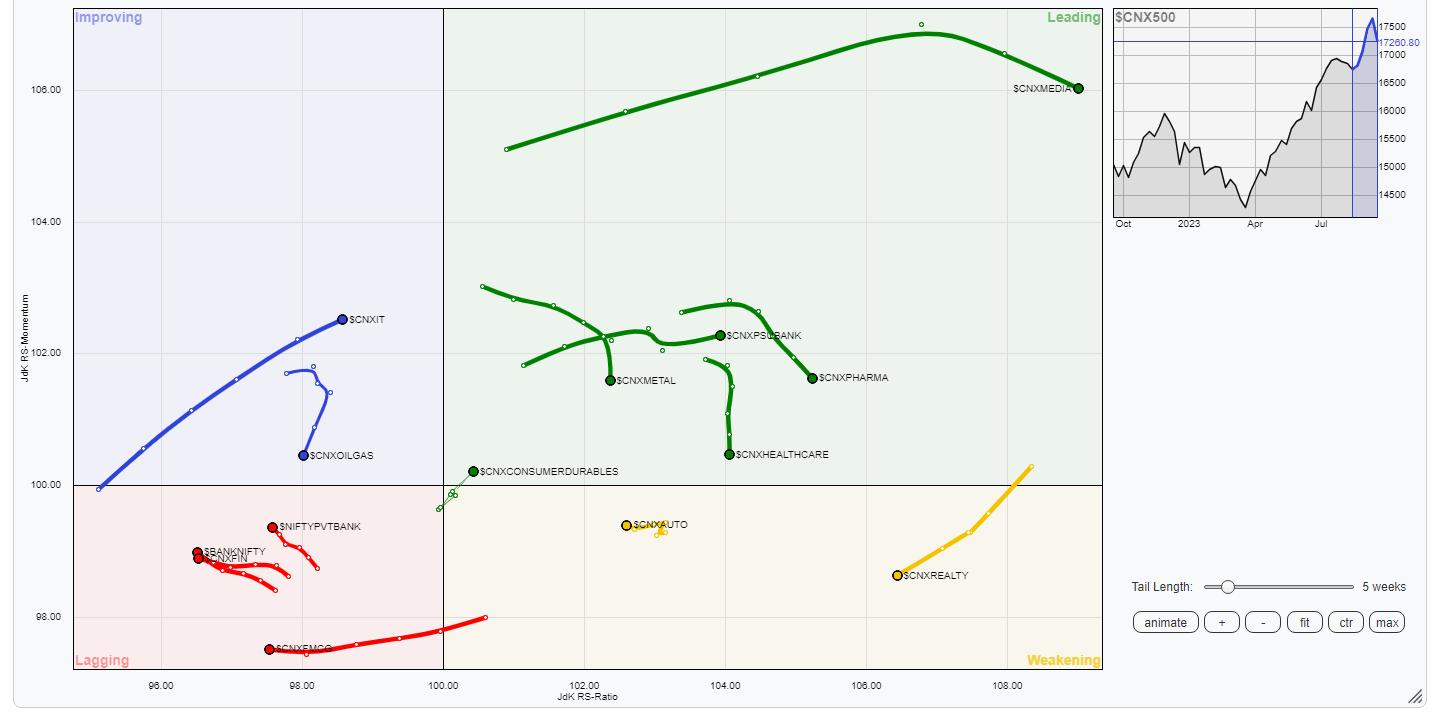
Relative Rotation Graphs (RRG) show that Nifty Energy, Mid-cap 100 index, PSU bank, Pharma, Metal, PSE, and Infrastructure indices are inside the leading quadrant of the RRG. While sectors like Metal and Pharma are giving up on their relative momentum, these groups are likely to show relative outperformance against the broader Nifty 500 index.
The Nifty Realty and Auto indices are inside the weakening quadrant of the RRG. Stock-specific performances may be seen from these groups, but overall the relative outperformance is unlikely.
Nifty Consumption, FMCG, Financial Services, and Bank Nifty are inside the lagging quadrant of the RRG, and this may lead to relative underperformance from these groups. The Nifty Service sector index is also inside the lagging quadrant; however, it is seen improving on its relative momentum and is on the verge of entering the improving quadrant.
The Nifty IT and Commodities indices are inside the improving quadrant and are seen rolling in the North East direction. They may continue to better their relative performance against the broader Nifty 500 index.
Important Note: RRG™ charts show the relative strength and momentum of a group of stocks. In the above Chart, they show relative performance against NIFTY500 Index (Broader Markets) and should not be used directly as buy or sell signals.
Milan Vaishnav, CMT, MSTA
Consulting Technical Analyst