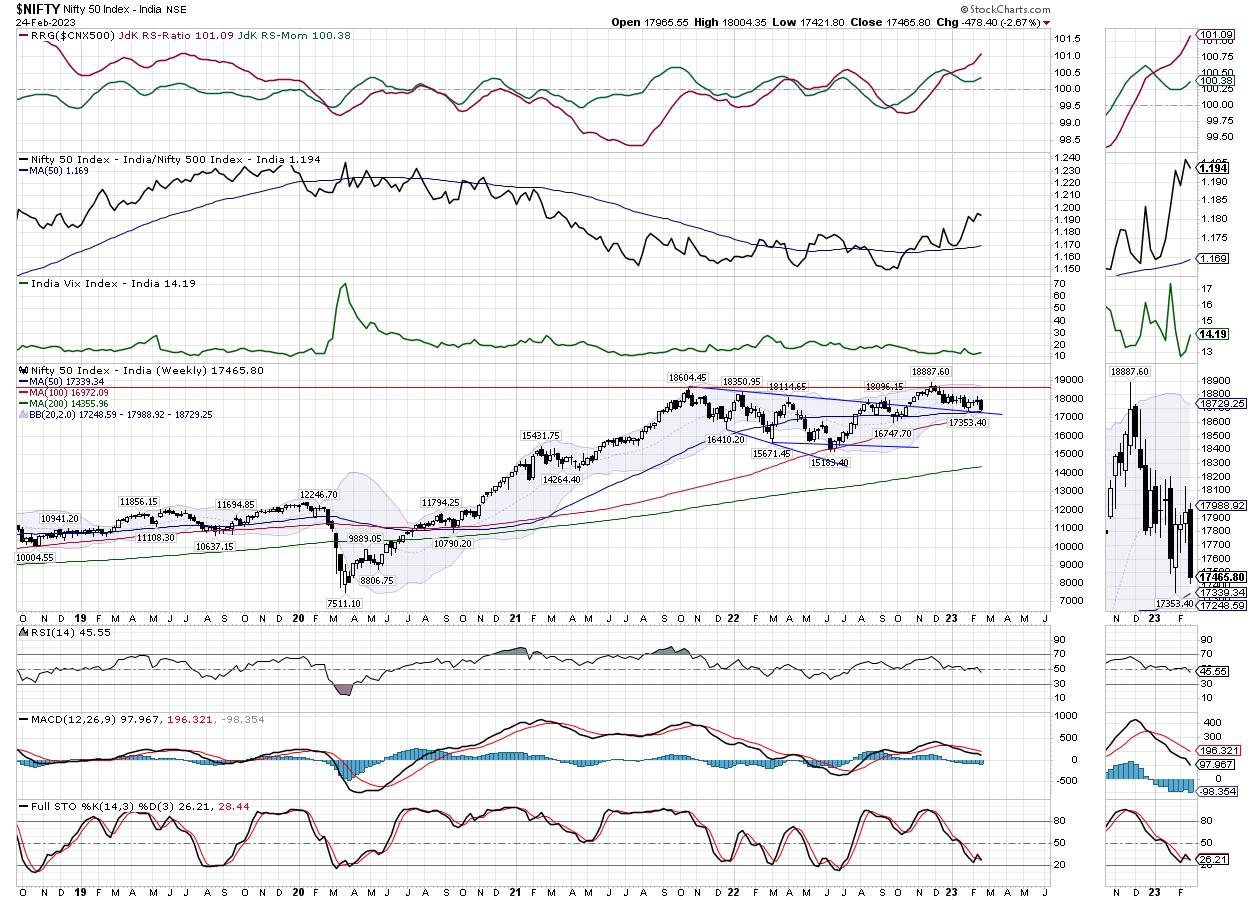
It was a weak performance for the equity markets; after heading nowhere over the past two weeks despite staying volatile, the markets gave up some strength as they closed the week on a negative note. In the previous technical note, it was mentioned about the VIX, i.e., INDIAVIX was at its lowest levels in recent times. It was expected that any spike in volatility would adversely affect the indices. The trading range got a bit wider for the NIFTY as well. Compared to the 415 points, this week the index oscillated in a 582.55 points range. After an overall bearish week, the headline index NIFTY50 ended with a net loss of 478.40 points (-2.67%) on a weekly basis.
The global trade setup remains weak; US Dollar Index has shown renewed strength and this may not play out well for commodities and metal stocks. It was the third week in a row that the NIFTY has resisted the 20-Week MA, but this time it finally corrected from there. This makes the 20-Week MA which is placed at 17988 a formidable and most immediate resistance point for NIFTY in the short term. The NIFTY is very close to the 50-Week MA; this is placed at 17339, and it is expected to act as a support on a closing basis for the Index. As of now, the most likely trading range for the NIFTY would be 17300-18000 levels; any violation of 17300 levels will invite incremental weakness for the markets.
A tepid start is expected for the week; the levels of 17600 and 17780 are likely to act as resistance; supports are expected to come in at 17300 and 17210 levels.
The weekly RSI is 45.55; it has marked a new 14-period low which is bearish. However, it remains neutral and does not show any divergence against the price. The weekly MACD is bearish and trades below the signal line. PPO is negative.
The pattern analysis of the weekly charts hint at the level of 17339, i.e., the 50-Week MA as a likely and important support for the NIFTY. This is not only an important week MA, but it also coincides with the falling trend line pattern support. This falling trend line begins from the high point of 18604, joins the subsequent lower tops, and extends itself. The convergence of these two levels may act as important support for the NIFTY. In other words, any violation of this important convergence area of support may make the index weaker.
The markets must be approached on a highly selective and defensive note. The markets may find support at lower levels; also, as per F&O data, there are shorts in the system which may lead to some short-covering from the lower levels. In either case, it would be prudent to stay invested in low-beta stocks while keeping the overall leveraged exposures at modest levels. While protecting profits on either side, a cautious approach is advised for the coming week.
Sector Analysis for the coming week
In our look at Relative Rotation Graphs®, we compared various sectors against CNX500 (NIFTY 500 Index), which represents over 95% of the free float market cap of all the stocks listed
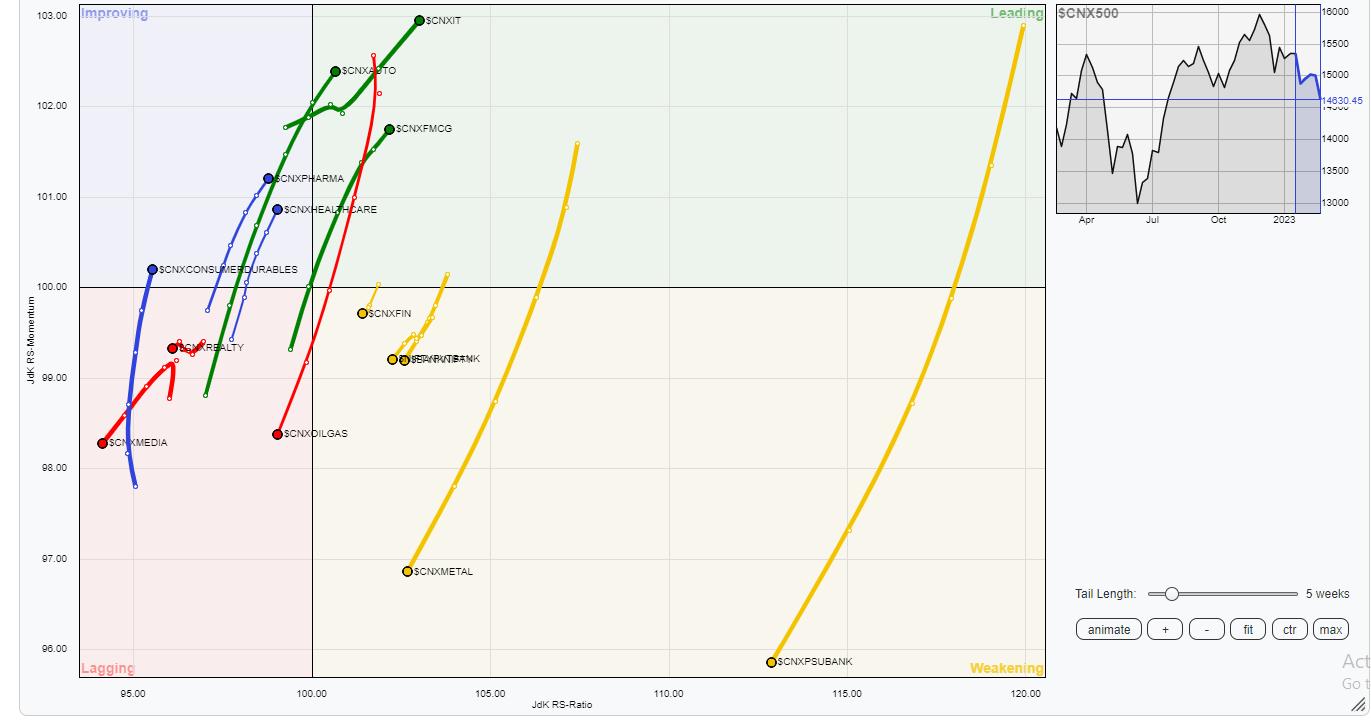
The analysis of Relative Rotation Graphs (RRG) shows that the markets are now distinctly wearing a defensive look and this is pretty much evident by the sector rotation that is taking place. We have IT, Auto, FMCG, and the PSU sectors that are inside the leading quadrant. They are likely to continue to relatively outperform the broader NIFTY 500 index.
NIFTY Metal, Commodities, Financial Services, Banknifty, PSU Bank, and Service Sector indices are inside the weakening quadrant. Their relative performance is likely to diminish a bit more going ahead from here. Nifty Infrastructure has also rolled inside the weakening quadrant.
NIFTY Energy, Realty, and Media index are seen languishing inside the lagging quadrant. The Energy group remains the weakest among all on relative terms.
NIFTY Pharma is firmly placed inside the improving quadrant. The NIFTY Consumption Index has just rolled inside the improving quadrant and this may potentially begin its period of relative outperformance against the broader markets.
Important Note: RRG™ charts show the relative strength and momentum of a group of stocks. In the above Chart, they show relative performance against NIFTY500 Index (Broader Markets) and should not be used directly as buy or sell signals.
Milan Vaishnav, CMT, MSTA
Consulting Technical Analyst