KEY
TAKEAWAYS
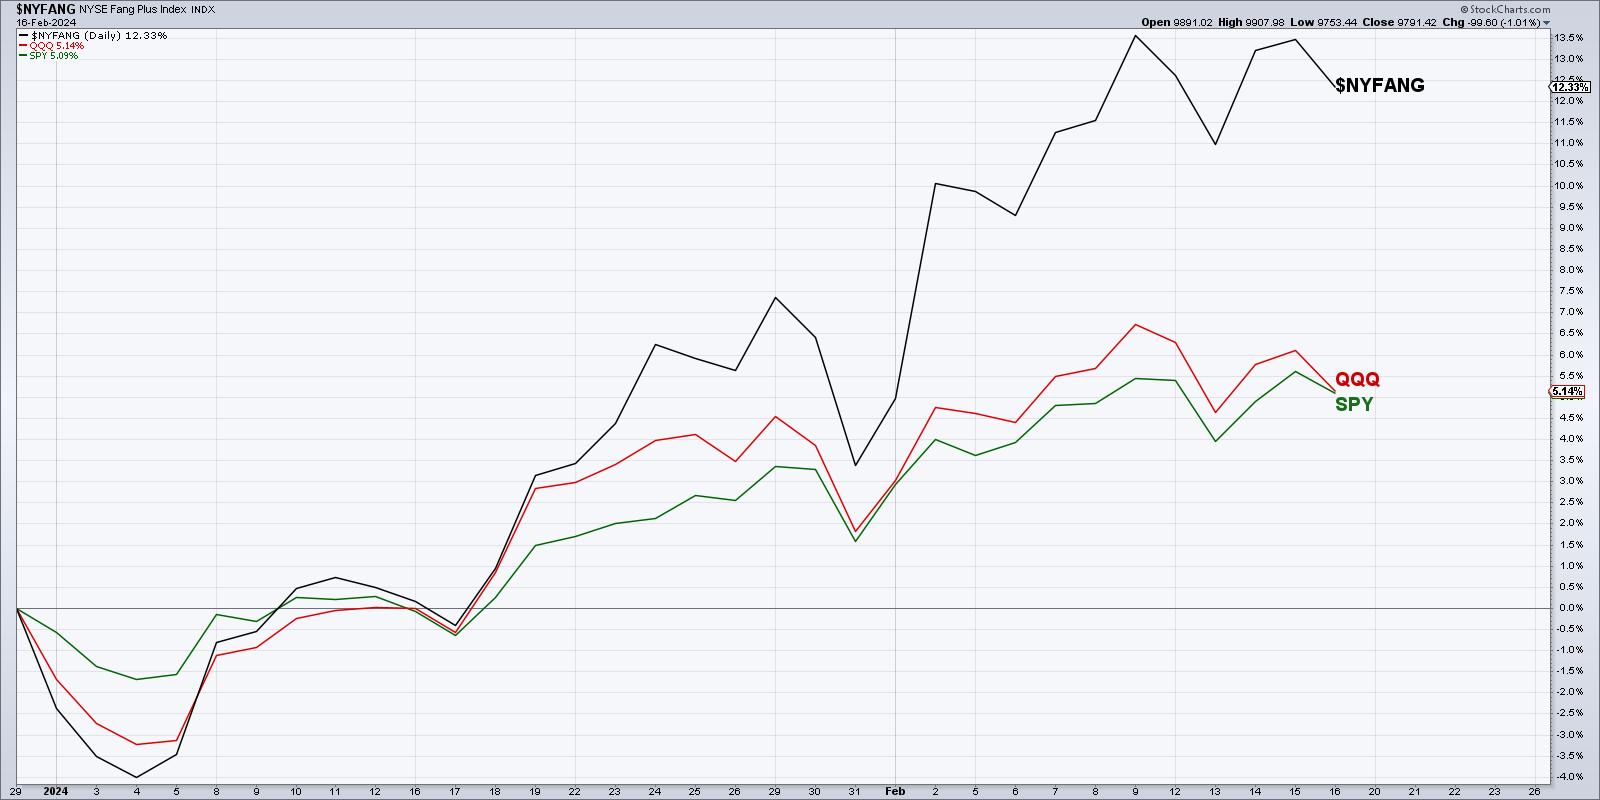
- The NYFANG+ index of leading growth stocks is up about 12% year-to-date, while the S&P 500 and Nasdaq 100 have gained only 5%.
- All three of these growth stocks show similar patterns, with a recent gap higher. But they have now all stalled out.
- If these leading names are unable to rotate higher, and instead fail to hold price gap support, this may indicate a broader bearish market phase has begun.
After a remarkably bullish January, which continued the strong market action in November and December, February has had a distinctly different feel. But while breadth conditions have certainly become less bullish than they were at year-end 2023, and the Hindenburg Omen has announced a potential end to the bullish phase, the growth leadership names have overall remained quite strong. The NYFANG+ index of leading growth stocks is up about 12% year-to-date, while the S&P 500 and Nasdaq 100 have gained only 5%.
This chart highlights the “performance gap” between the mega-cap growth names and basically everything else. But while stocks like NVDA are making headlines for their relentless uptrends and new all-time highs, it may be more important here to watch names that have recently gapped higher. In a bullish market phase, breakouts tend to proliferate as leading stocks push to new highs. But at the end of a bullish phase, you often see signs of an exhaustion of buyers, as the anecdotal last buyer has made their final purchase.
I think the three most important growth stocks to watch here are Meta Platforms (META), Amazon.com (AMZN), and Netflix (NFLX). Let’s review these stocks together, noticing the similarities between all three over the last two years.
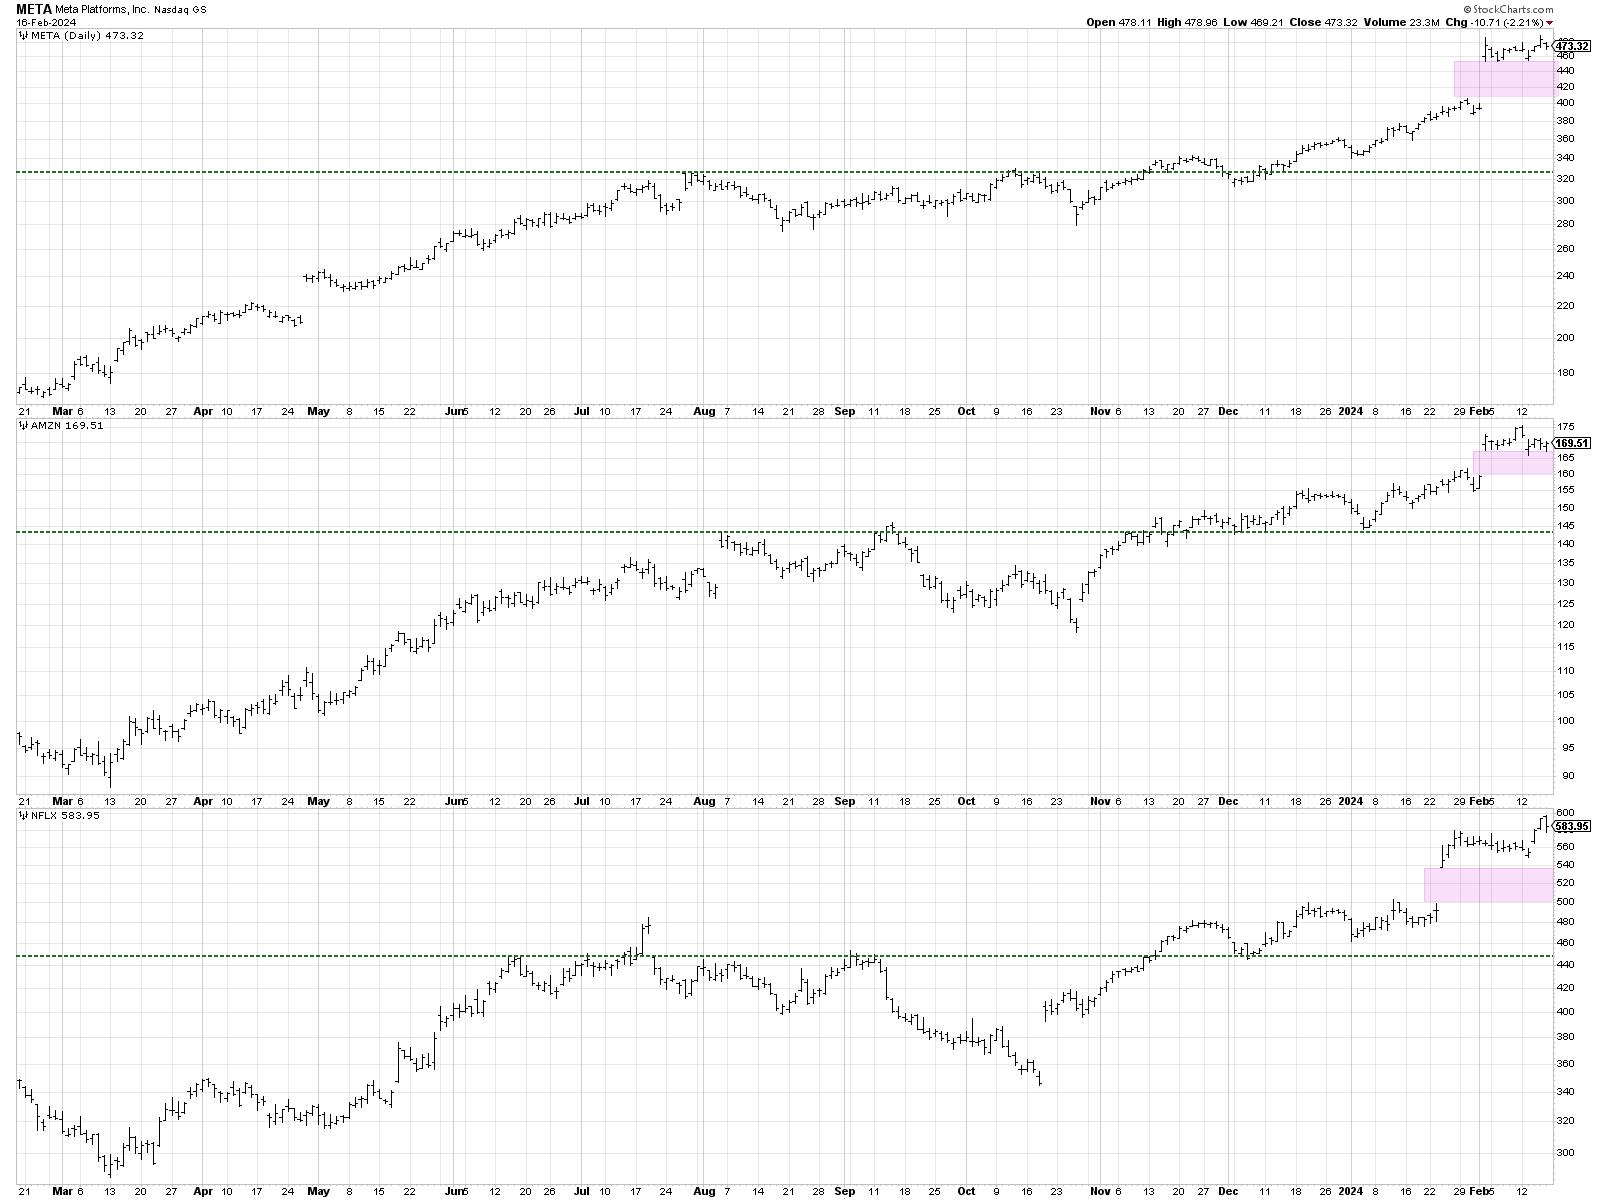
META rallied up to around $325 in July 2023, then spent the next three to four months testing that same resistance level. AMZN experienced a very similar pattern, with a high in August 2023 around $143. For NFLX, it was a high in June and then a failed breakout above the $450 level in July.
All three of these names experienced a breakout above that “pivot point” in November and December, and then all three gapped higher on their first quarter earnings release in mid-January to early February. But something interesting has happened after that gap higher a couple weeks back.
Notice how all three have essentially been rangebound after the gap higher? All three names have attempted to break above the initial range set after the price gap, and all three have failed to break out of the range. Netflix finished the week with a Dark Cloud Cover candle pattern, with a big up day followed by a big down day closing below the midpoint of the first day.
I’ve found the period right after a price gap to be so very crucial in assessing investor sentiment. If a stock gaps higher and then trades higher, it shows that additional buyers are coming in and are willing to pay more for the same stock. If a stock trades lower after a price gap, it suggests profit-taking, where earlier investors are thrilled to get out for a profit.
But these three charts are sort of stalled out in limbo, with no clear upside confirmation and, so far, no breakdown of gap support. I have price alerts set for each of these three names at the upper end of their recent price gaps, as I feel that this represents a “line in the sand” not just for these three growth stocks, but perhaps for the broad market as a whole.
There is no denying the seasonal weakness at this point in an election year. February into March tends to be a weaker time of year, and the deteriorating breadth conditions seem to be lining up with this traditional calendar phenomenon. But I think the most important market tell may be the ability of these three leading growth names and whether they are able to hold their recent price gaps. And if those price gaps fail to hold, then our growth-oriented benchmarks may really start to feel the pain.
RR#6,
Dave
P.S. Ready to upgrade your investment process? Check out my free behavioral investing course!
David Keller, CMT
Chief Market Strategist
StockCharts.com
Disclaimer: This blog is for educational purposes only and should not be construed as financial advice. The ideas and strategies should never be used without first assessing your own personal and financial situation, or without consulting a financial professional.
The author does not have a position in mentioned securities at the time of publication. Any opinions expressed herein are solely those of the author and do not in any way represent the views or opinions of any other person or entity.