KEY
TAKEAWAYS
- Growth-Value Rotating Back in Favor of Growth
- Large-Cap stocks picking up Strength Over Mid- and Small-cap segments
- Hence, Large-Cap Growth Stands out Positively
RRG sending a clear message
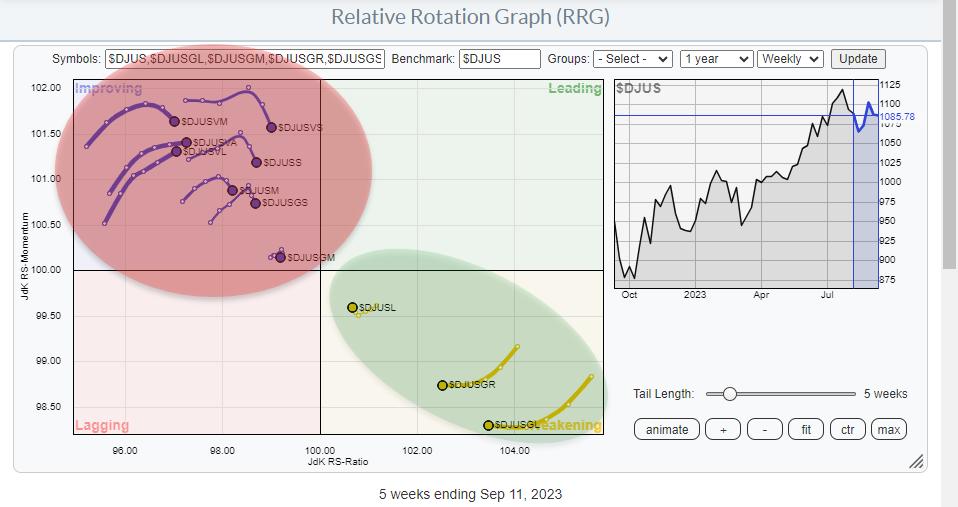
The Relative Rotation Graph above shows the rotation for the combined Size and Growth/Value segments in the market.
And the message is pretty clear.
First of all, there are NO tails inside the leading- and no tails inside the lagging quadrant. That suggests that a big rotation is underway. This observation is supported by the second observation. This is the fact that all blue tails inside the improving quadrant are in the process of rolling over. On the opposite side, the orange tails inside the weakening quadrant are all (three of them) starting to curl back up, or close to it.
We know that rotations that complete on either the right- or the left-hand side of the RRG are characteristic of a very strong relative up- or downtrend. And that seems to be the case at the moment.
Growth vs. Value
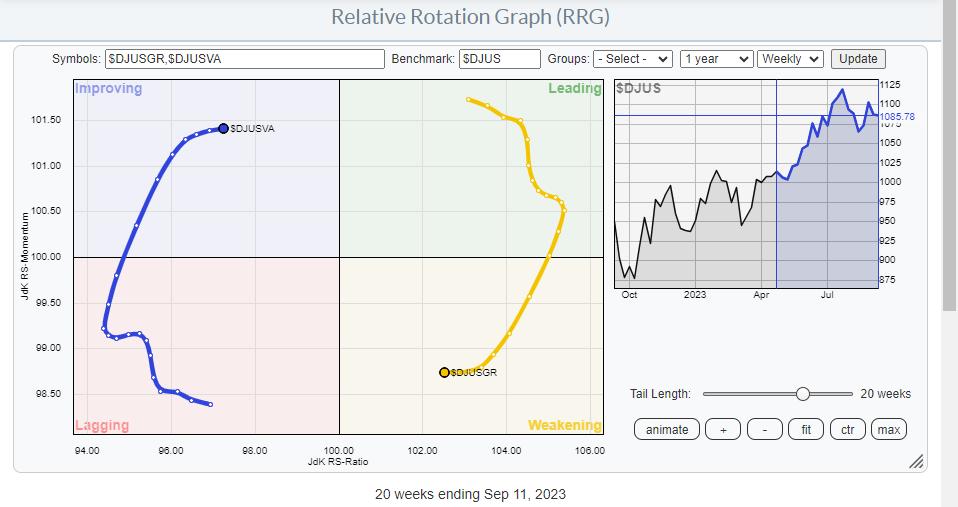 When we break down this universe into its growth and value segments we can see the isolated rotations for growth vs. value. After a counter-trend move with value picking up relative momentum and growth losing relative momentum, these tails are now starting to roll back up/down. Given the current distance from the 100 level on the RS-Ratio scale, growth on the positive side, and value on the negative side, there is enough “room” for the market to continue its rotation in the current direction. That will bring growth back up towards the leading quadrant and push value back into the lagging quadrant.
Large-Mid-Small
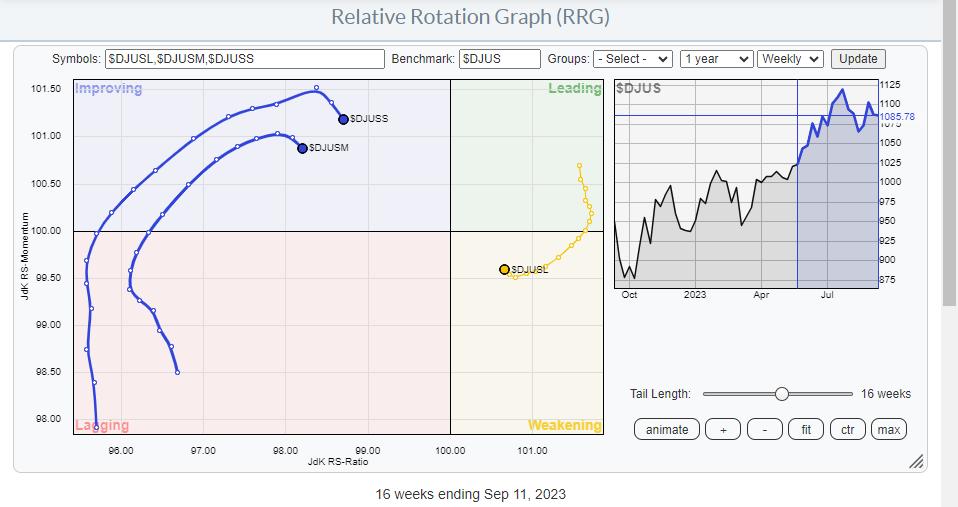
When we do the same for the size segment, again we see that rotation, isolated, and magnified.
Mid- and small caps are inside the improving quadrant and starting to roll over and move back down to lagging. Large caps are inside the weakening quadrant and have already started to curl back up and move toward the leading quadrant.
Merging these two RRGs gives us the RRG at the top of this article which sends a pretty clear message, pointing to Large-Cap-Growth as the best segment in the market for the time being.
US Large-Cap Growth
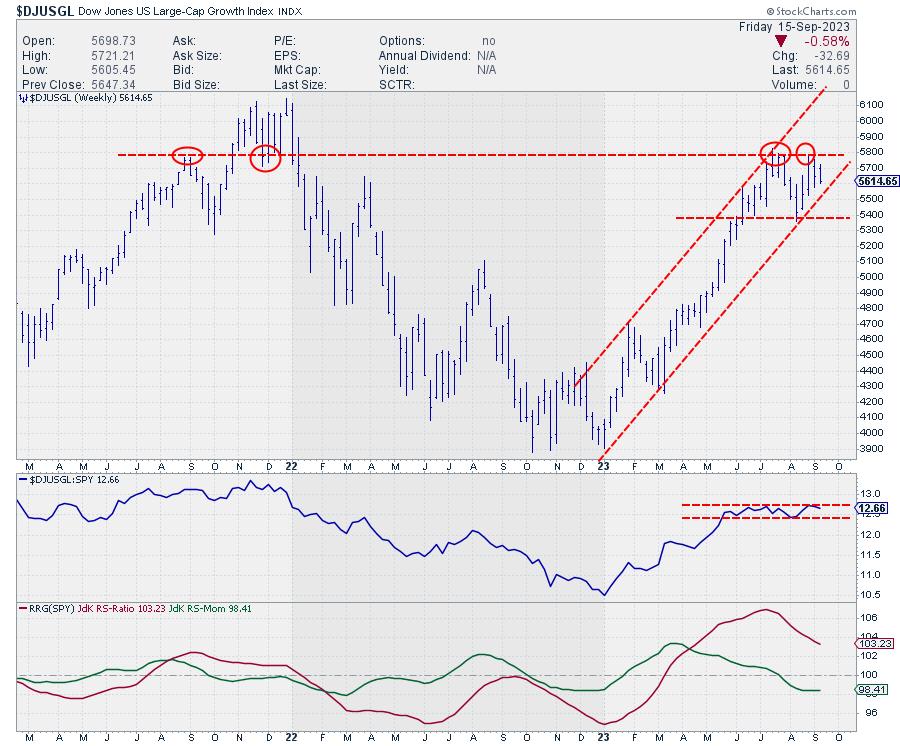
The price chart for US Large Cap Stocks ($DJUSGL) is still well within the boundaries of its rising trend channel. Three weeks ago $DJUSGL tested horizontal resistance near 5780. This level has been in play since September 2021 and showed up as either support or resistance multiple times which makes it a level to watch.
Once this barrier can be cleared, new upside potential will be unlocked, targeting the all-time high levels which were set at the end of 2021 around 6100 giving us a 5.5% upside potential.
From a relative perspective, raw RS is moving sideways after a nice run-up since the start of the year. This consolidation is causing the RRG-Lines to drop back and bring RS-Ratio down from its highest level over the last three years. With RS-Momentum below 100 but already leveling off and ready to start moving higher, this positions the tail for $DJUSGL inside the weakening quadrant and curling back up. Ready to complete a rotation on the right-hand side of the RRG, as we know one of the strongest setups and the start of a new up-leg in an already rising (relative) trend.
#StayAlert and have a great week, –Julius
Sunday/Monday I will be traveling back from Redmond, WA to Amsterdam. So a new episode of Sector Spotlight will be recorded later in the week.
Julius de Kempenaer
Senior Technical Analyst, StockCharts.com
Creator, Relative Rotation Graphs
Founder, RRG Research
Host of: Sector Spotlight
Please find my handles for social media channels under the Bio below.
Feedback, comments or questions are welcome at Juliusdk@stockcharts.com. I cannot promise to respond to each and every message, but I will certainly read them and, where reasonably possible, use the feedback and comments or answer questions.
To discuss RRG with me on S.C.A.N., tag me using the handle Julius_RRG.
RRG, Relative Rotation Graphs, JdK RS-Ratio, and JdK RS-Momentum are registered trademarks of RRG Research.