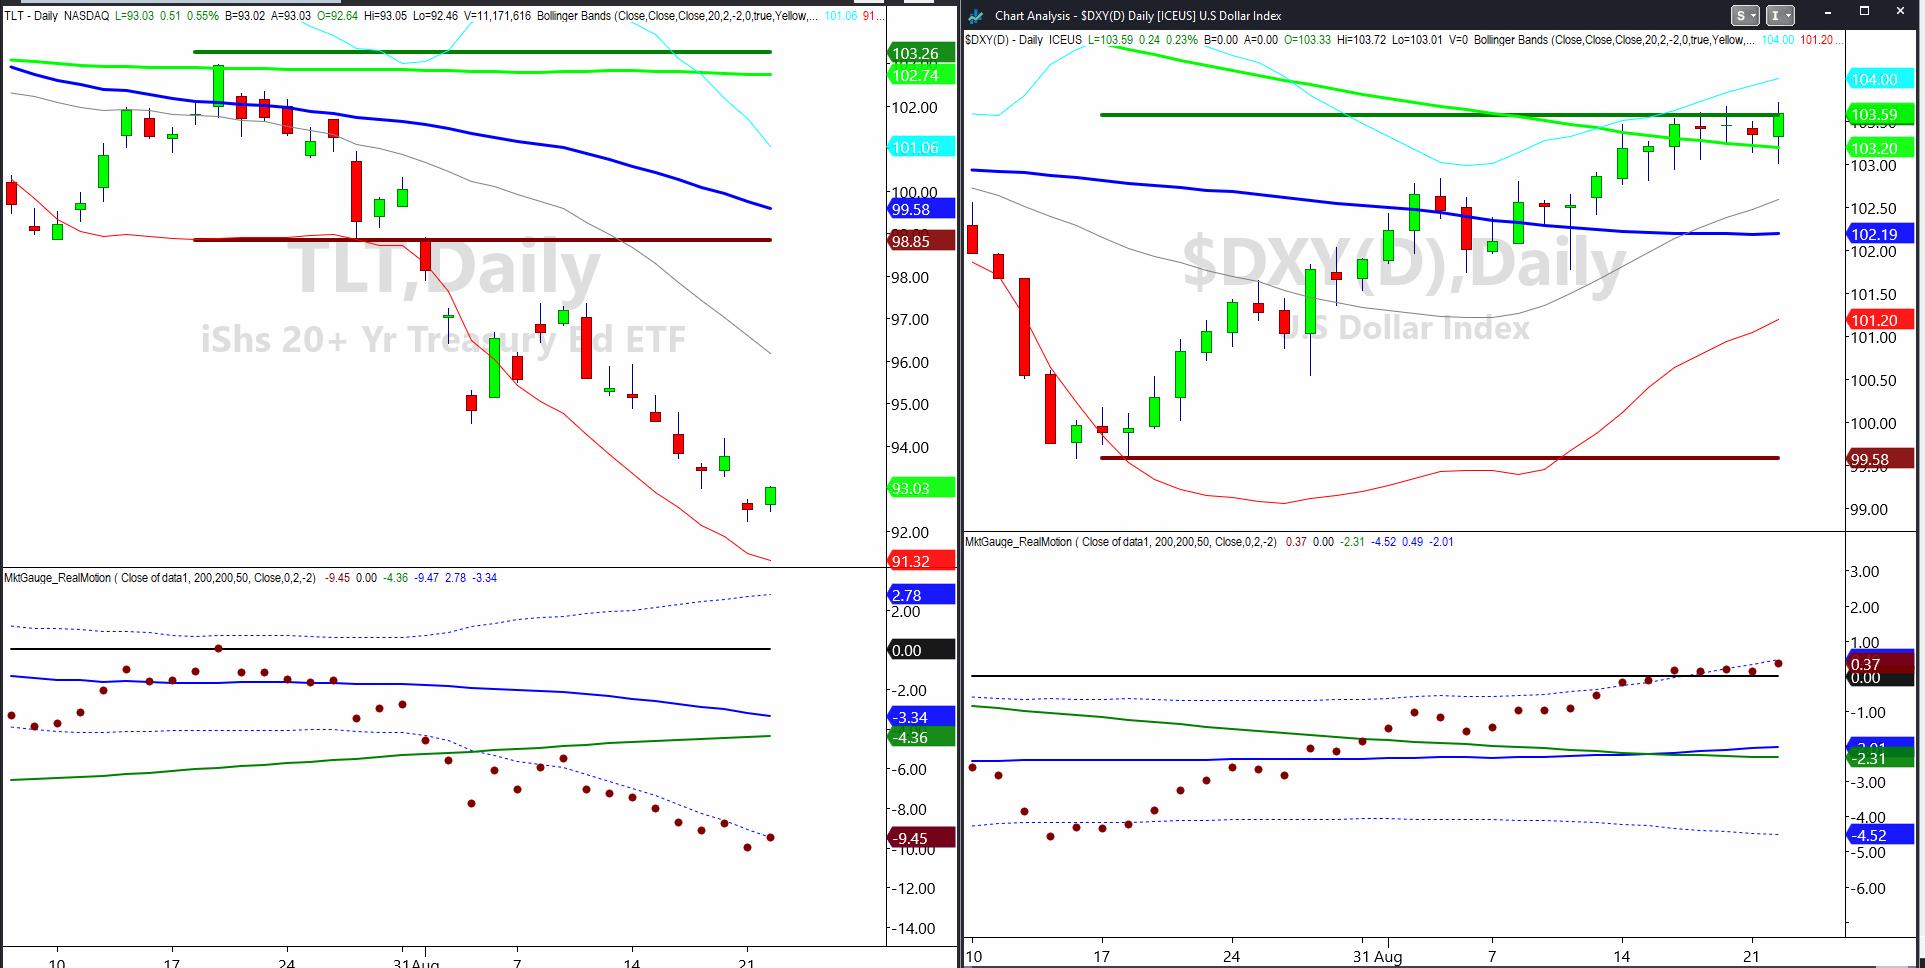
With BRICS happening ahead of Jackson Hole, we thought it would be good to look at the technical charts on both the dollar and the long bonds.
The chart below shows that BRICS vs. G7 as a share of purchasing power has increased since 1995. With the number of countries looking to price goods in some other currency besides the US dollar, the dollar is holding up rather well.

And with “higher for longer” most likely the narrative out of Jackson Hole, the long bonds caught a bid. The lesson this entire year has been to follow price and the technical guidance the charts provide. With that in mind, we look at 3 indicators on both charts.
- Price patterns
- Momentum patterns
- July 6-month calendar range patterns
The long bonds TLT could have made a genuine reversal off the lows, as our Real Motion indicator had a bona fide mean reversion signal. The price also indicates a glass bottom pattern with a reversal off a new low, followed by a strong up day on below-average volume.
TLT is so well below the July 6-month calendar range low that one has to wonder not only can it get back to 98.85, but what the implications are if it does so. The dollar, as far as price, has a lot of resistance between 103.50-103.70. In fact, that resistance lines up perfectly with the July 6-month calendar range high. Above that level, one would have to believe that the dollar will get even stronger. Nonetheless, as we have seen with the calendar ranges in the indices, since none cleared the July 6-month CRH, the selloff was palpable.
Momentum shows resistance at the Bollinger Band that is also working off of a mean reversion sell signal from a few days ago. However, the price is flat.
If you put both charts together, we see the potential for the dollar to drop from here while yields could soften and TLTs could rise. If this occurs, it is not good for equities or risk. But, perhaps, quite good for gold and silver.
For more detailed trading information about our blended models, tools and trader education courses, contact Rob Quinn, our Chief Strategy Consultant, to learn more.
If you find it difficult to execute the MarketGauge strategies or would like to explore how we can do it for you, please email Ben Scheibe at Benny@MGAMLLC.com.

“I grew my money tree and so can you!” – Mish Schneider
Get your copy of Plant Your Money Tree: A Guide to Growing Your Wealth and a special bonus here.
Follow Mish on Twitter @marketminute for stock picks and more. Follow Mish on Instagram (mishschneider) for daily morning videos. To see updated media clips, click here.
Read Mish’s commentary on Gold in these two articles from Kitco.
Mish and Nicole discuss where to park your money, barring any watershed event, in this video from Schwab Network.
On the Friday, August 18 edition of StockCharts TV’s Your Daily Five, Mish covers bonds, the dollar, risk-off indications and several key commodities with actionable levels to consider.
Mish joins Maggie Lake of Real Vision to discuss what rising bond yields mean for investors across the market landscape, what comes next for stocks and commodities, and why she is taking profits here in the growth and AI stocks.
Mish shows why January and now the July reset worked in this appearance on Business First AM.
Mish discusses Alibaba’s stock price in this appearance on CNBC Asia.
In this guest appearance on David Keller’s The Final Bar on StockCharts TV, talks higher rates and why China may deserve a second look for investors.
Mish discusses inflation, bonds, calendar ranges and places to park your money on the Benzinga Morning Prep show.
Mish covers why August is a good time for caution in this appearance on Business First AM.
Mish and Jared go over oil and what might happen with small caps and regional banks in this appearance on Yahoo! Finance.
Coming Up:
August 24: Mario Nawfal Spaces hosted by Dr. Danish
August 24: Live Coaching with Mish
August 28: Chuck Jaffe, Money Show & Guest host on The Final Bar, StockCharts TV
September 7: Singapore Breakfast Radio, 89.3 FM
October 29-31: The Money Show
- S&P 500 (SPY): 437 is the July 6-month calendar range low–will look for a return above or a trip to 420.
- Russell 2000 (IWM): 181.94 the low of last week is key; 180.72 the 6-month calendar range low.
- Dow (DIA): 337 key support.
- Nasdaq (QQQ): 363 the July 6 month CRL, BUT held a key weekly MA at 357 with NVDA earnings on tap.
- Regional Banks (KRE): Failed 44.00 on bank downgrades–no bueno.
- Semiconductors (SMH): 145 a weekly MA support level, with 150 pivotal.
- Transportation (IYT): Getting heavy with next big support at 239 if this is to hold.
- Biotechnology (IBB): Compression between 124-130.
- Retail (XRT): 62.80 the July 6-month calendar range low, failed today–consumer is key, and this is also no bueno.
Mish Schneider
MarketGauge.com
Director of Trading Research and Education