
SPX Monitoring Purposes: Sold 11/29/23 at 4550.58 = gain 10.52%; long SPX 10/27/23 at 4117.37.
Gain Since 12/20/22: 26.8%.
Monitoring Purposes GOLD: Long GDX on 10/9/20 at 40.78.
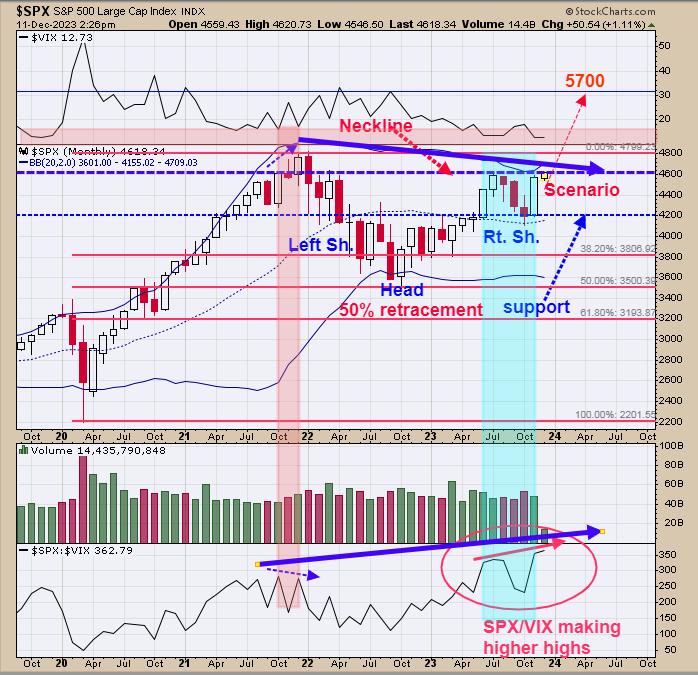
Above is the monthly SPX. The bottom window is the SPX/VIX ratio. It’s common for this ratio to lead the SPX, and right now the monthly SPX/VIX has made a higher high above the July high, as well as above the January 2023 high, suggesting that, at some point, the SPX will trade above the July high and the January 2023 (noted with thick blue arrows). SPX is just at the July high now, but could fade this week as, seasonality-wise, this is the fourth weakest week of the year. We are only looking for a pullback that could setup the next bullish signal. The pattern that appears to be forming is a head-and-shoulders bottom, where the head is the October low and the right shoulder is forming now. Lets see how the week goes.
We sold our long SPX on close of 11/29/23 at 4550.58 for a gain of 10.52%. Long from SPX 10/27/23 at 4117.37.

If you remember, we got out in July near the high (sold on 7/21/23 at 4536.34 SPX), and the reason we sold our long SPX position was because of the chart above. The middle window is the daily VIX/VVIX ratio. It’s usually a bearish sign for the SPX when this ratio is rising along with the SPX (noted in shaded pink). This ratio has been rising from the first of December (over a week), suggesting the current rally may stall in the coming days. This indicator give strength to the notion that this week, seasonality-wise, is the fourth-weakest week of the year. The next potential pullback could produce a bullish setup.
Tim Ord,
Editor
www.ord-oracle.com. Book release “The Secret Science of Price and Volume” by Timothy Ord, buy at www.Amazon.com.
Signals are provided as general information only and are not investment recommendations. You are responsible for your own investment decisions. Past performance does not guarantee future performance. Opinions are based on historical research and data believed reliable; there is no guarantee results will be profitable. Not responsible for errors or omissions. I may invest in the vehicles mentioned above.