According to the Stock Trader’s Almanac, August has been the weakest month for the Dow and the second-worst month for the S&P 500 since 1987. (September is the worst month). This seasonal weakness, coupled with over exuberance among investors, has set the markets up for at least a pause after last week’s pullback puts both the S&P 500 and Nasdaq into a near term downtrend.
Among the catalysts for last week’s pullback was an uptick in interest rates along with an intolerance for less than perfect earnings reports that pushed down stocks such as mega-cap Apple (AAPL), among other companies. Earnings season can be a critical period for the markets as investor sentiment is revealed based on trader’s response to results. In bullish periods such as last quarter, negative news is overlooked. A case in point is Apple’s rally following their May 4th release of 1st quarter results, which also showed declining overall sales.
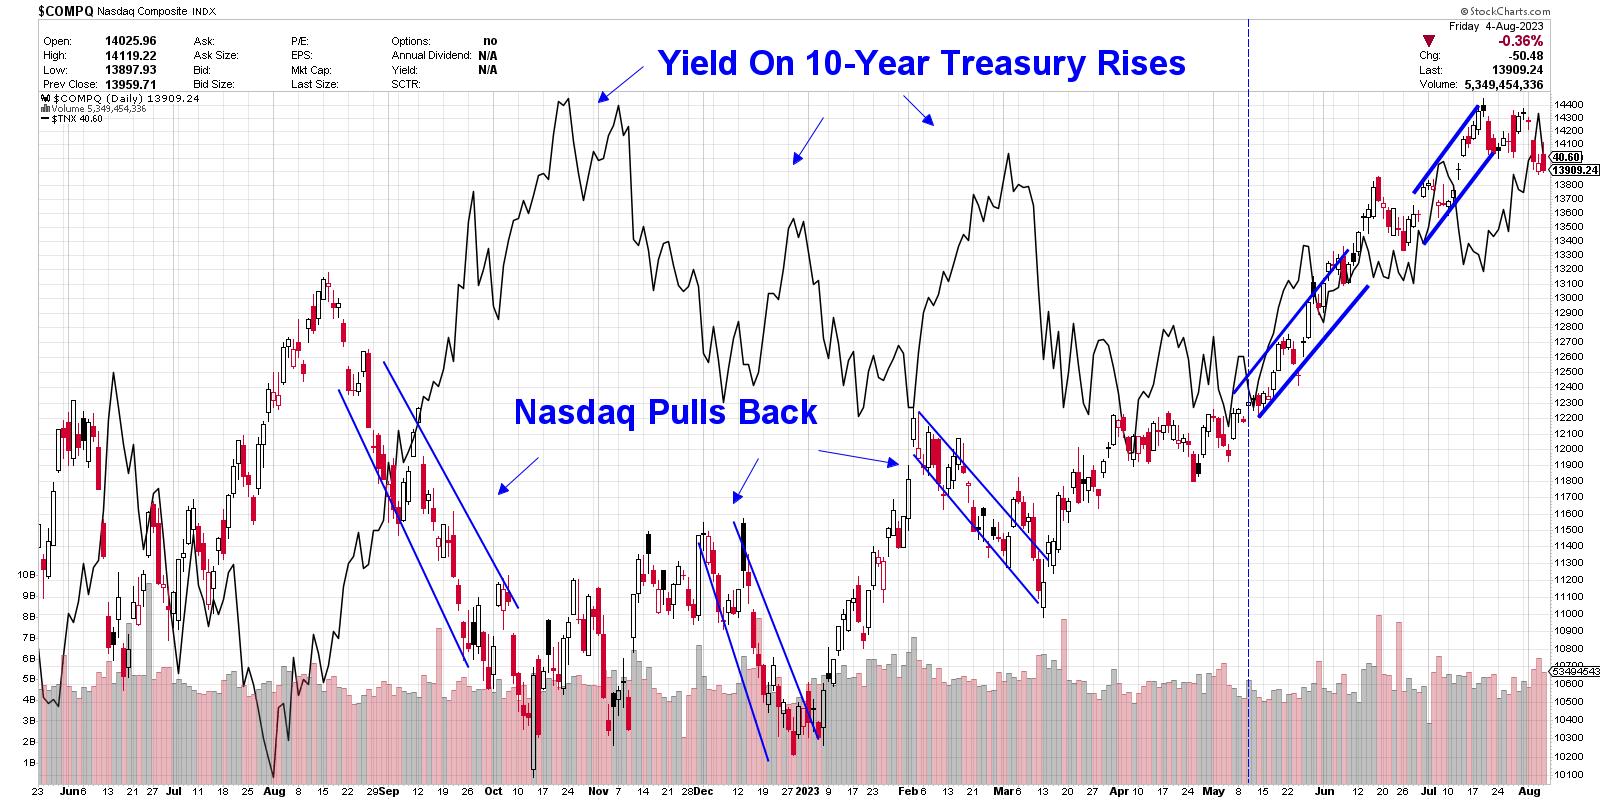
As for rising interest rates, they’re often a cause of angst for the markets – particularly for Growth stocks due to a reduced valuation of their future earnings. Since mid-May, the Growth-heavy Nasdaq has been trending higher despite a rise in yields as investors have been focused on reports of tempered inflation amid a stable economy. This is a departure from earlier periods when the Nasdaq has pulled back amid a rise in rates.
Daily Chart of Nasdaq Composite vs. 10-Year Yield
Whether you take action based on last week’s break in the markets will have everything to do with your investment horizon. Short-term investors will want to lock in at least partial profits and stem losses while keeping an eye on key areas of support for the broader markets. Longer-term investors can look to longer-term charts for guidance, as the monthly chart of the S&P 500 shows that the longer-term uptrend remains in place.
Below is a daily chart of the S&P 500 where I highlight the next area of possible support, which is at its 50-day moving average and is 1.6% away. Should the markets reverse trend, possible upside resistance will initially be the 10- and 21-day moving averages followed by the late July high in price at 4600. A move above this key level will set the stage for further upside.
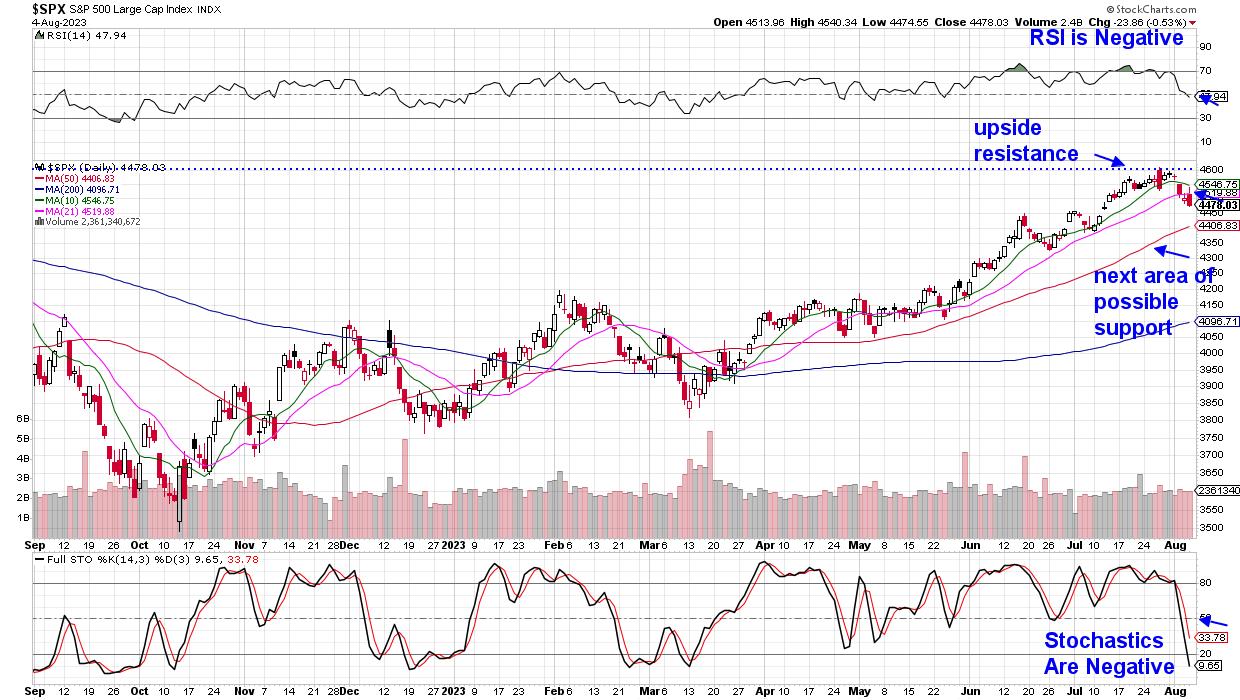 Daily Chart of S&P 500 Index
If you’d like to be kept up to date on the status of the broader markets, as well as be alerted to one area that’s currently withstanding the downtrend elsewhere, use this link here to trial my twice weekly MEM Edge Report. This no-obligation offer will provide you with instant access to current reports.
Warmly,
Mary Ellen McGonagle, MEM Investment Research