KEY
TAKEAWAYS
- Industrials sector XLI broke to new highs and is on a strong rotational path on the Relative Rotation Graph
- Within the sector the groups “Commercial Vehicles & Trucks” and “Trucking” stand out
- These groups are taking over from Airlines and Construction which have been leading the sector higher over the past weeks/months
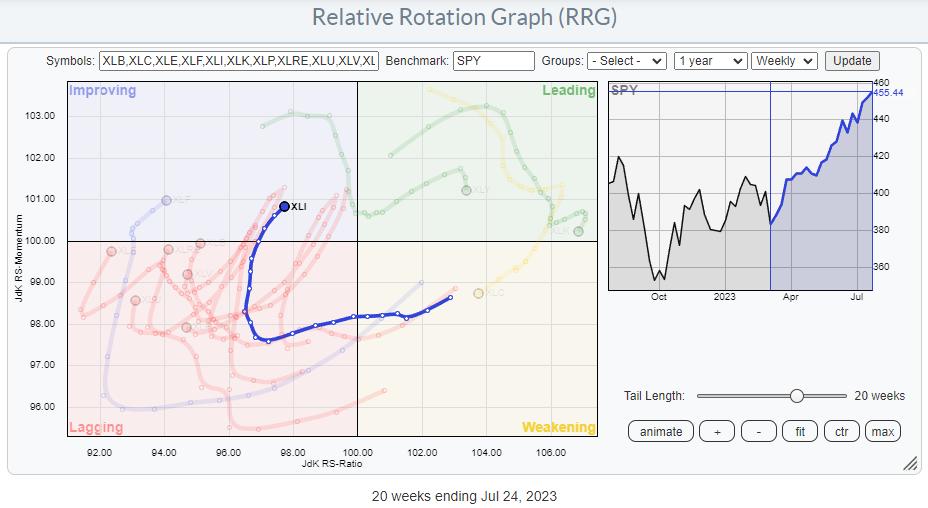
On the Relative Rotation Graph for sectors above I have highlighted the trail of the Industrials sector over the last 20 weeks. The trajectory coming out of the lagging quadrant into improving and now turning into an RRG Heading between 0-90 degrees suggests that further improvement is ahead of us.
Industrials Breaking To New All-Time-Highs
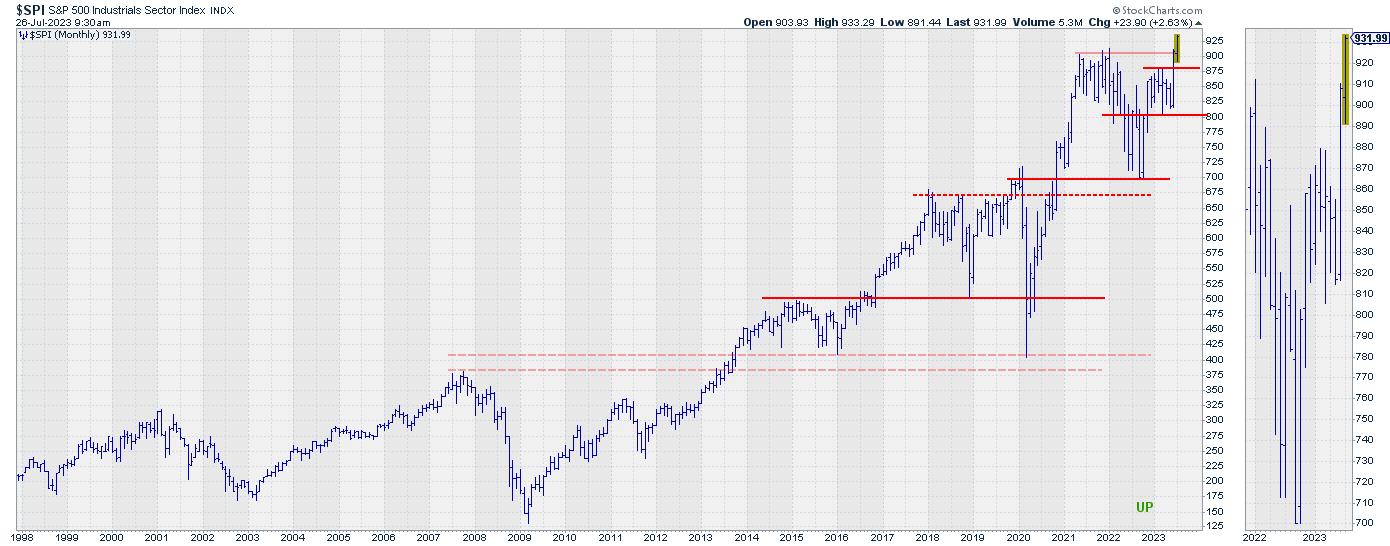
In this episode of Sector Spotlight at the start of July, I pointed out that the Industrials sector was one of two (the other being Information Technology) breaking to new all-time highs, as seen on the monthly chart above.
This in itself is, of course, already a sign of strength.
The rotation on the RRG is now starting to add the relative strength component to that strength as well.
Break Down into Industries
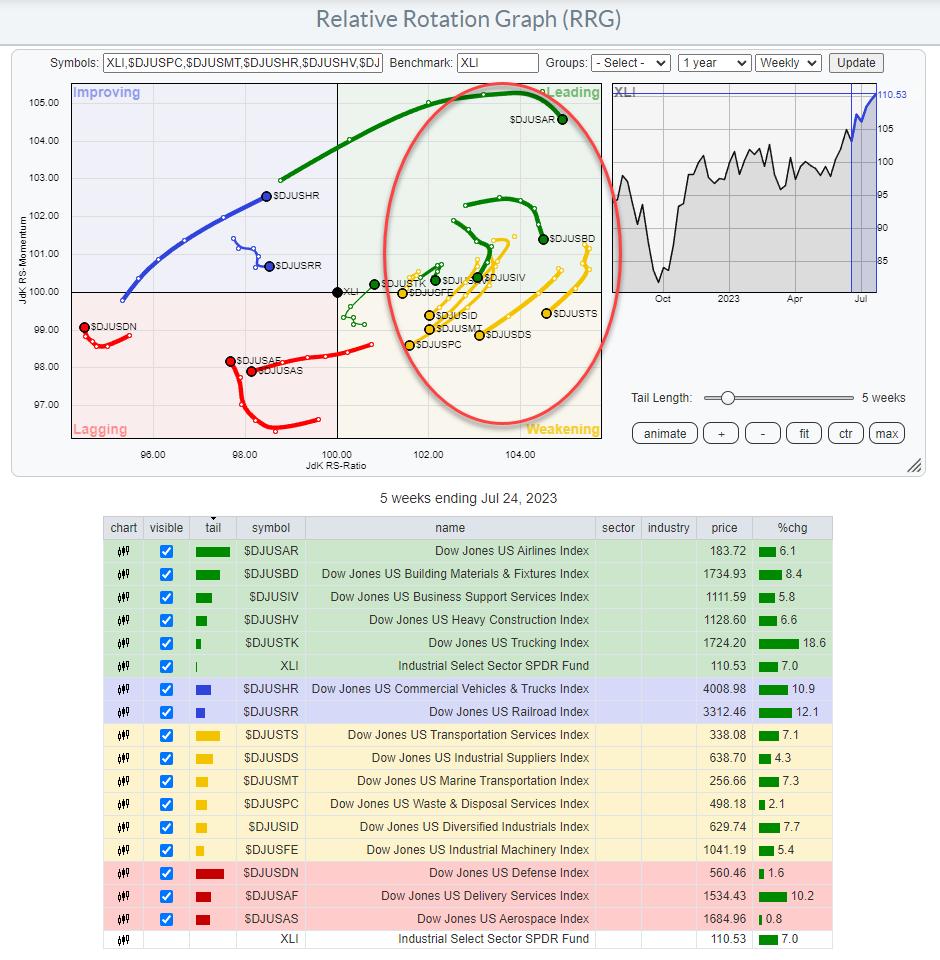
When we step from sectors into the industries that make up the Industrials sector, we see a lot of industries that have recently rolled over inside the leading quadrant and have then rolled over into weakening.
Out of the remaining industries, three are inside lagging; Defense, Delivery Services, and Aerospace. Despite the small pickup of relative momentum for Defence and Delivery, they remain in a relative downtrend vs. XLI.
The railroad industry is on a short tail inside the improving quadrant while losing some relative momentum which indicates that this industry is at a stable, yet relative downtrend vs XLI.
Out of these industries, which together make up the Indsutrials sector, there are currently two that stand out positively.
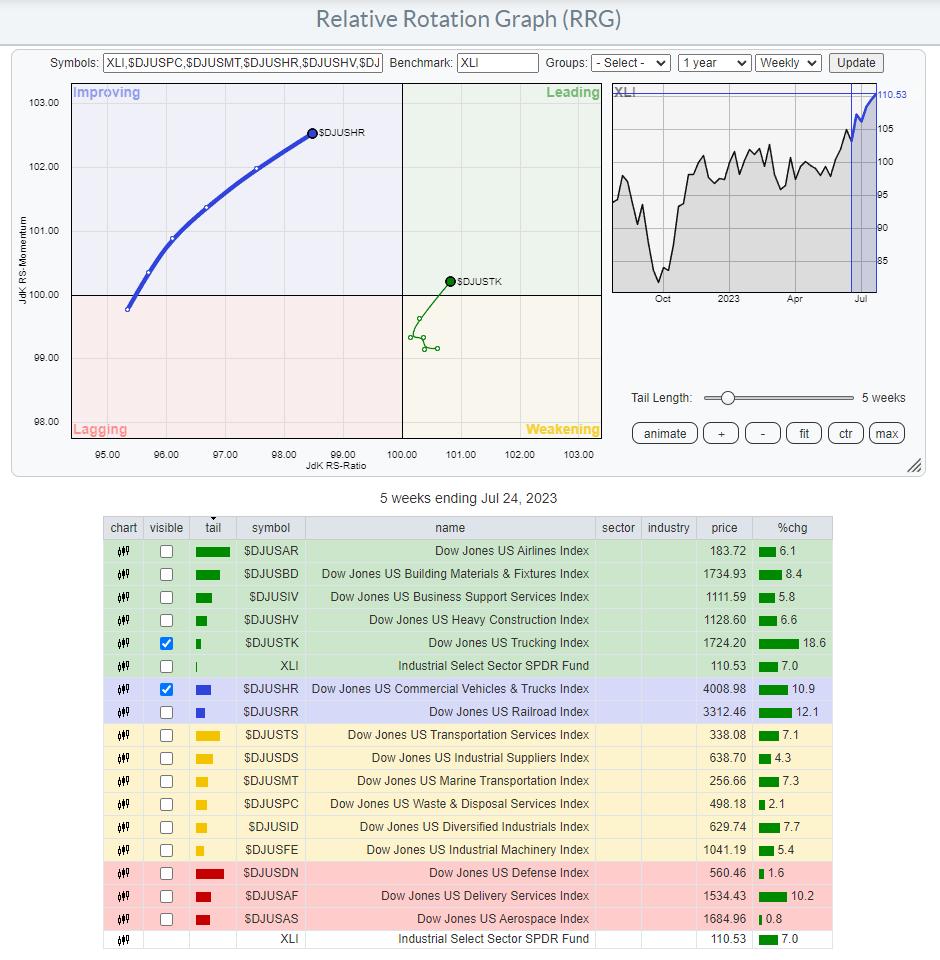
Commercial Vehicles & Trucks
$DJUSHR is inside the improving quadrant and heading towards leading at a long tail, indicating that there is strength behind this move.
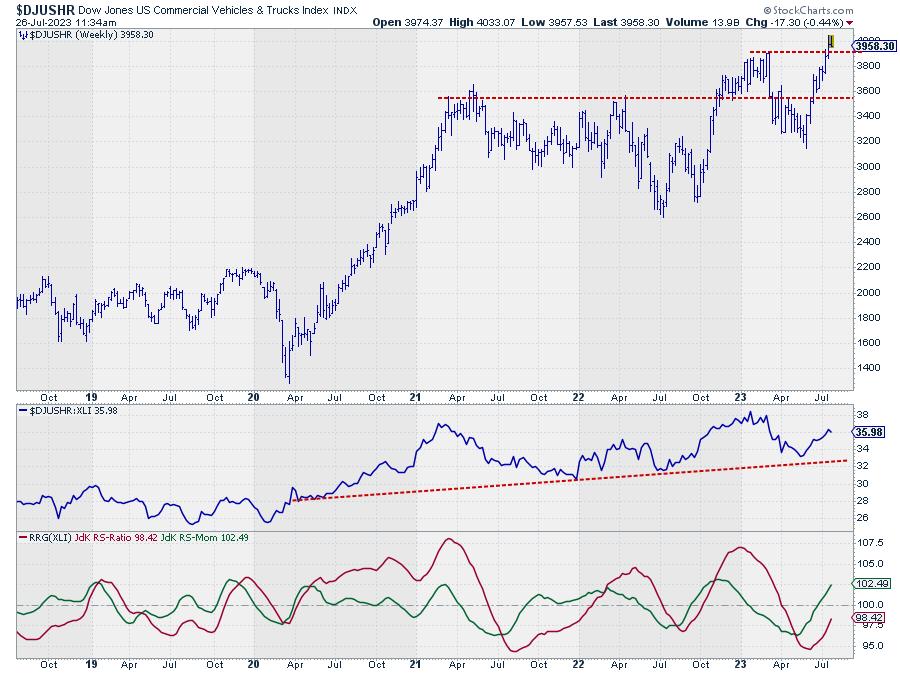
On the price chart, this index broke to new highs last week and is holding up well so far. The raw RS-Line is sloping up slightly and has just put in a new higher low which is pulling both RRG Lines higher.
This combination suggests a further leading role for this industry in the weeks ahead.
Trucking
$DJUSTK has recently completed a rotation through weakening and then back into leading. So completing a rotation completely on the right-hand side of the RRG, which we know is a strong sign.
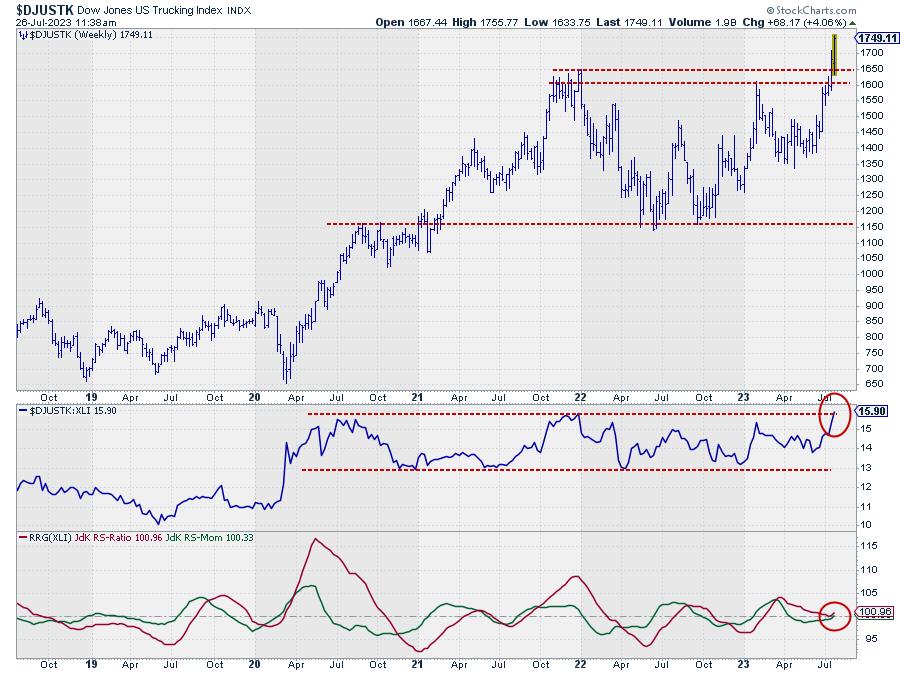
The upward break in this index is more vicious than we saw in the previous chart. Also, the raw RS-Line is about to break upward from an almost three-year sideways range.
With the RS-Ratio line bottoming out above 100 and the RS-Momentum line moving back above 100, the rotation is completed without moving into the lagging quadrant (left-hand side of the RRG), which in itself is already a sign of strength.
New Industries taking the lead
After the big moves by airlines and construction stocks pulled the Industrials sector up and above its previous highs, it looks as if Trucking and Commercial Vehicles & Trucks are now taking over as the leading industries within the sector.
These are the stocks in these industries inside the S&P 500
Commercial Vehicles % Trucks : CAT,CMI,DE,PCAR,WAB
Trucking : CHRW,JBHT,ODFL
#StayAlert, –Julius
Julius de Kempenaer
Senior Technical Analyst, StockCharts.com
Creator, Relative Rotation Graphs
Founder, RRG Research
Host of: Sector Spotlight
Please find my handles for social media channels under the Bio below.
Feedback, comments or questions are welcome at Juliusdk@stockcharts.com. I cannot promise to respond to each and every message, but I will certainly read them and, where reasonably possible, use the feedback and comments or answer questions.
To discuss RRG with me on S.C.A.N., tag me using the handle Julius_RRG.
RRG, Relative Rotation Graphs, JdK RS-Ratio, and JdK RS-Momentum are registered trademarks of RRG Research.