
KEY
TAKEAWAYS
- The S&P 500 and Nasdaq Composite continue their winning streak
- Crude oil continues to slide as it trades below its 200-day moving average
If there were one thing that was surprising about the stock market, it would be how quickly the charts changed in November. Equities trended higher, yields fell, and crude cracked.
Treasury yields dropped—the 10-year yield dropped from close to 5% to around 4.5%—and is now below the support of its 50-day simple moving average (SMA). It’s worth focusing on the chart of the iShares 20+ Year Treasury Bond ETF (TLT), which, after reaching a low of 82.14, bounced higher to 89.58, crossing above its 50-day SMA (see chart below).
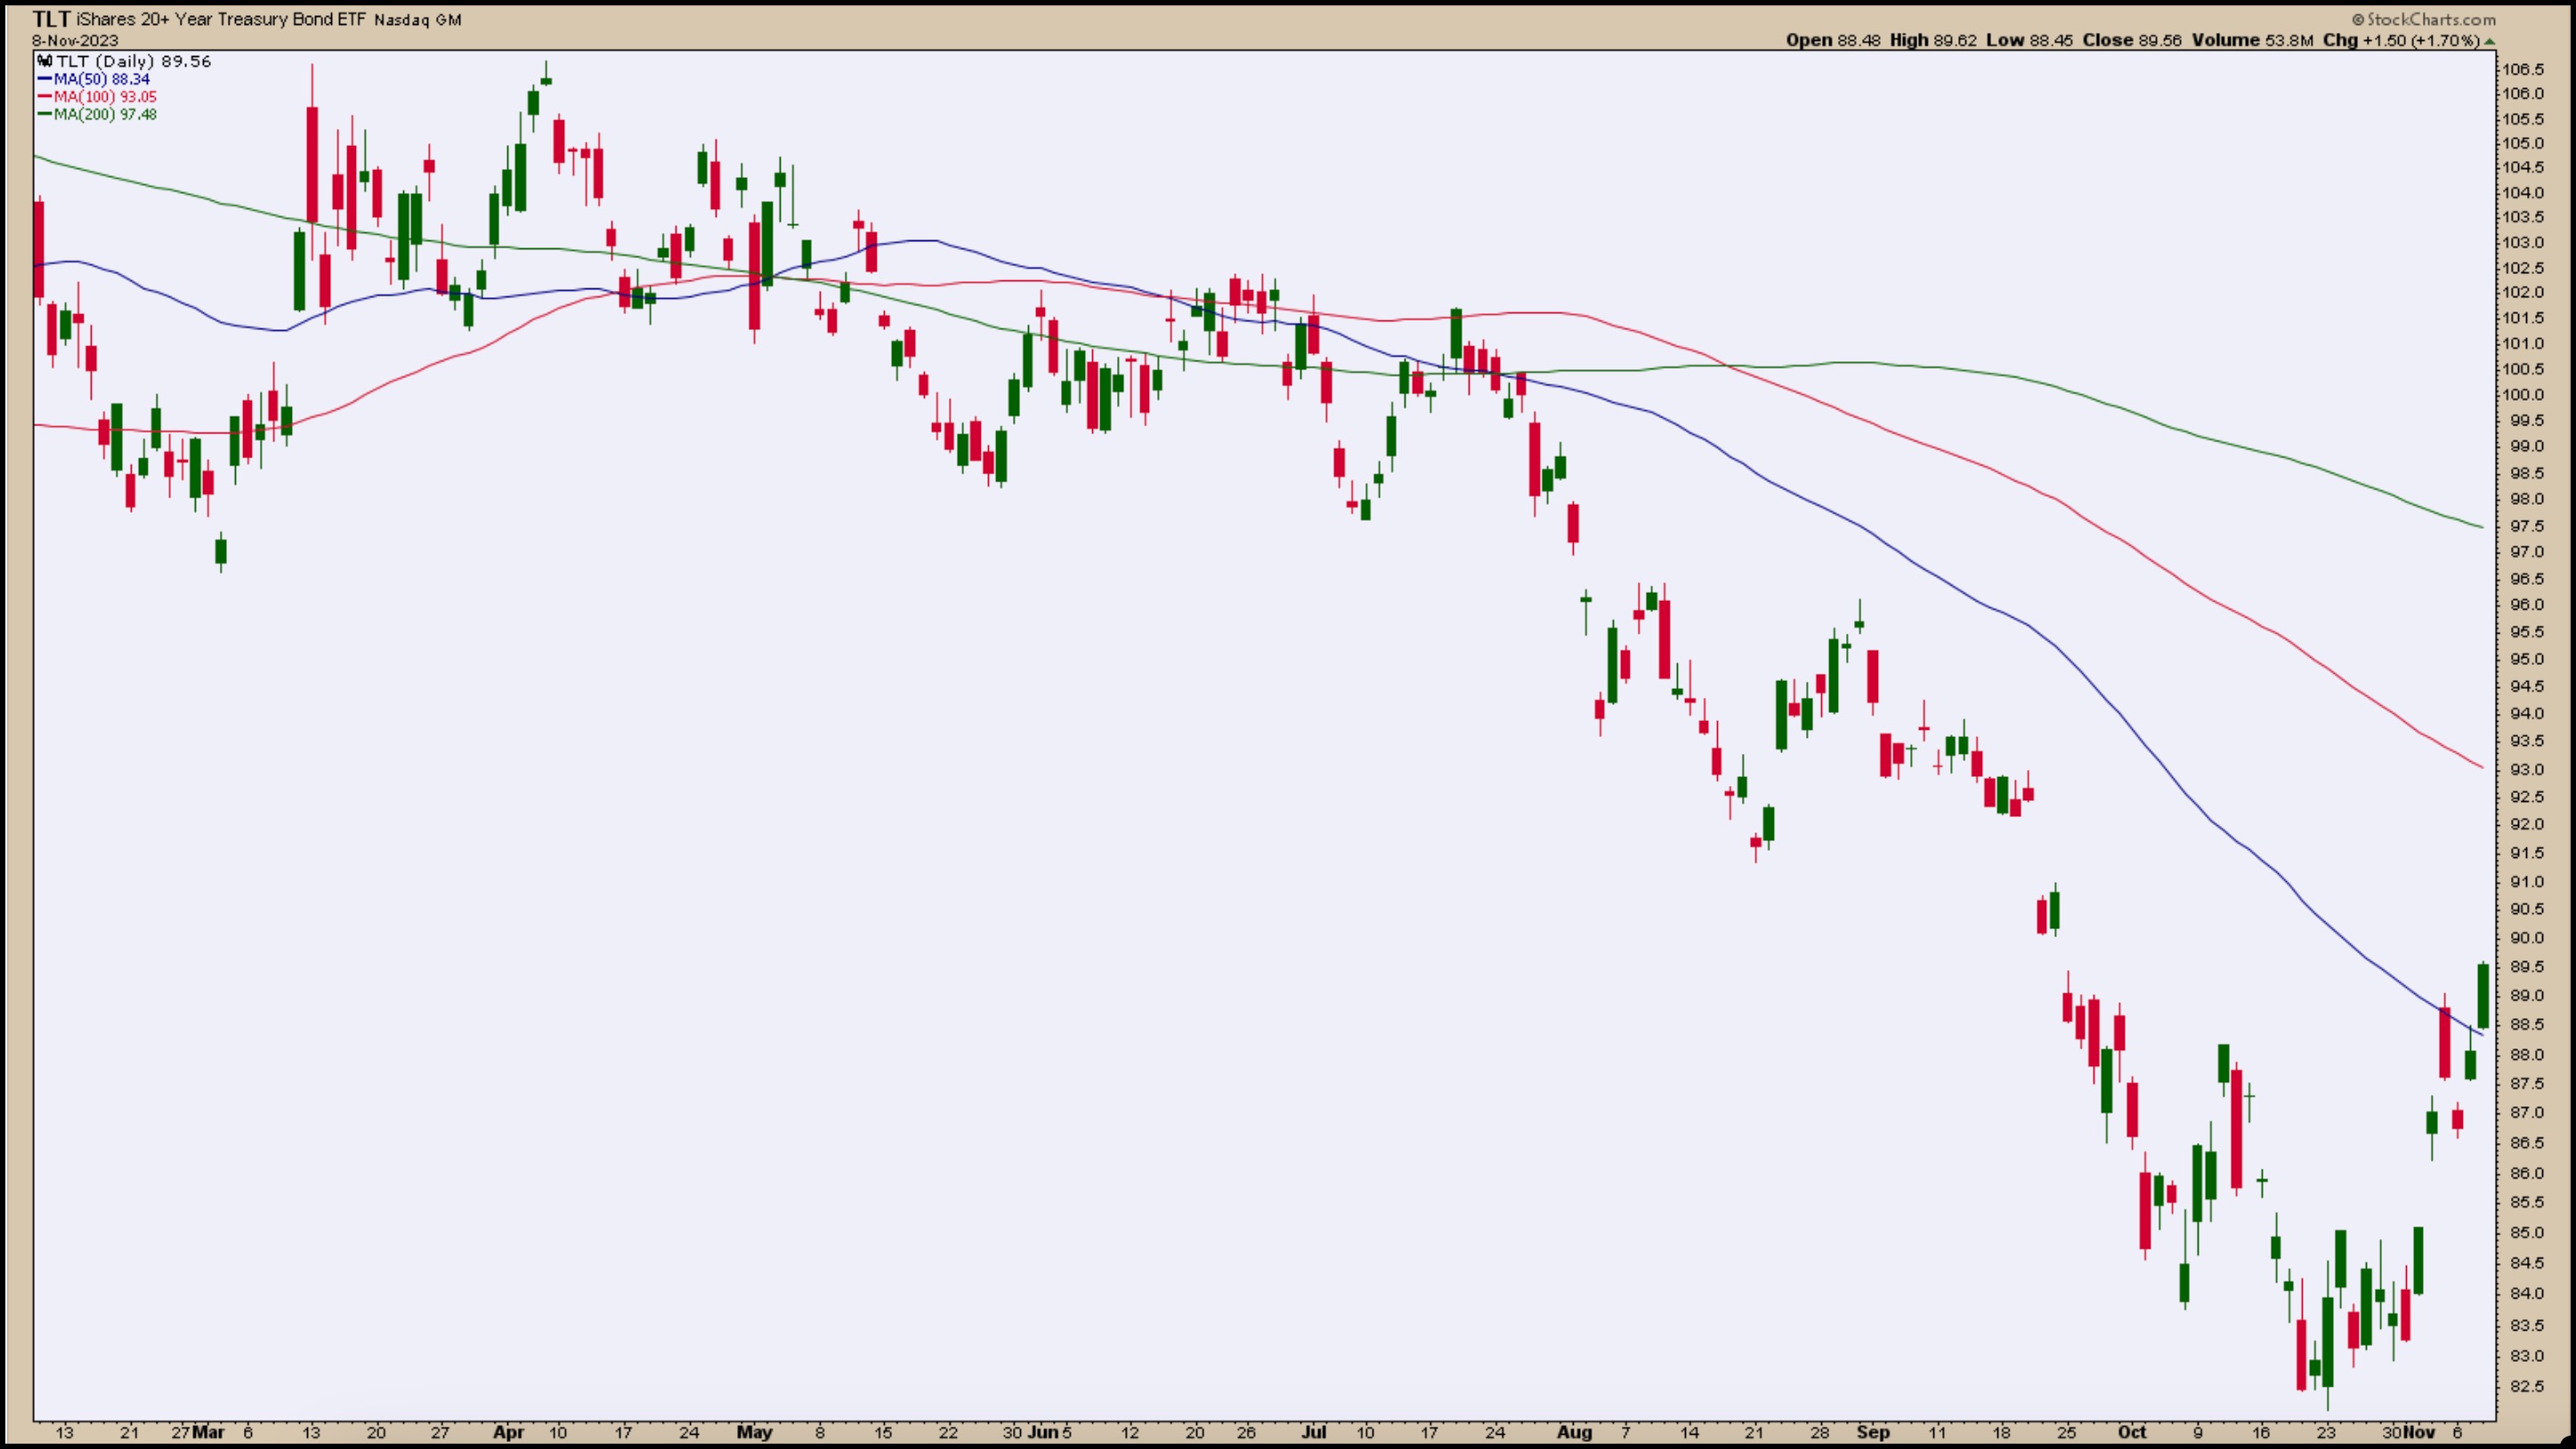
CHART 1: TLT RISES ABOVE ITS 50-DAY MOVING AVERAGE. Are bonds finally getting some love? It seems like it, but there’s still a ways to go before bonds confirm a bullish trend. Chart source: StockCharts.com. For educational purposes.
Mega-Cap Tech Stocks Shine Again
As bond prices rise, there has also been a rotation back into the big tech stocks. If you pull up stock charts of Microsoft (MSFT), NVIDIA (NVDA), Meta Platforms (META), or Apple (AAPL) you can see that they are still looking strong. The Nasdaq Composite ($COMPQ) completed a nine-day winning streak on Tuesday, while the S&P 500 ($SPX) had an eight-day winning streak. Both indexes are close to their previous high. A break above their previous highs would be positive for equities and would break the series of lower highs and, hopefully, the lower lows. However, that might take some time to play out, because the movement seems to have slowed as the index gets closer to its last high.
When the Nasdaq Composite has had an impressive winning streak, it’s easy to have an upside bias. But, at times like this, it’s best to peel the layers of the onion and look at what’s going on beneath the price bars. For this, it’s best to focus on market breadth.
The cumulative Nasdaq Advance-Decline Issues ($NAAD) is trending lower (see chart below). The percentage of Nasdaq stocks trading above their 50-, 100-, and 200-day moving averages has been trending higher since the index started its up move, but, given the magnitude of the move, you’d expect it to be higher than the 25–35% levels they are in now.
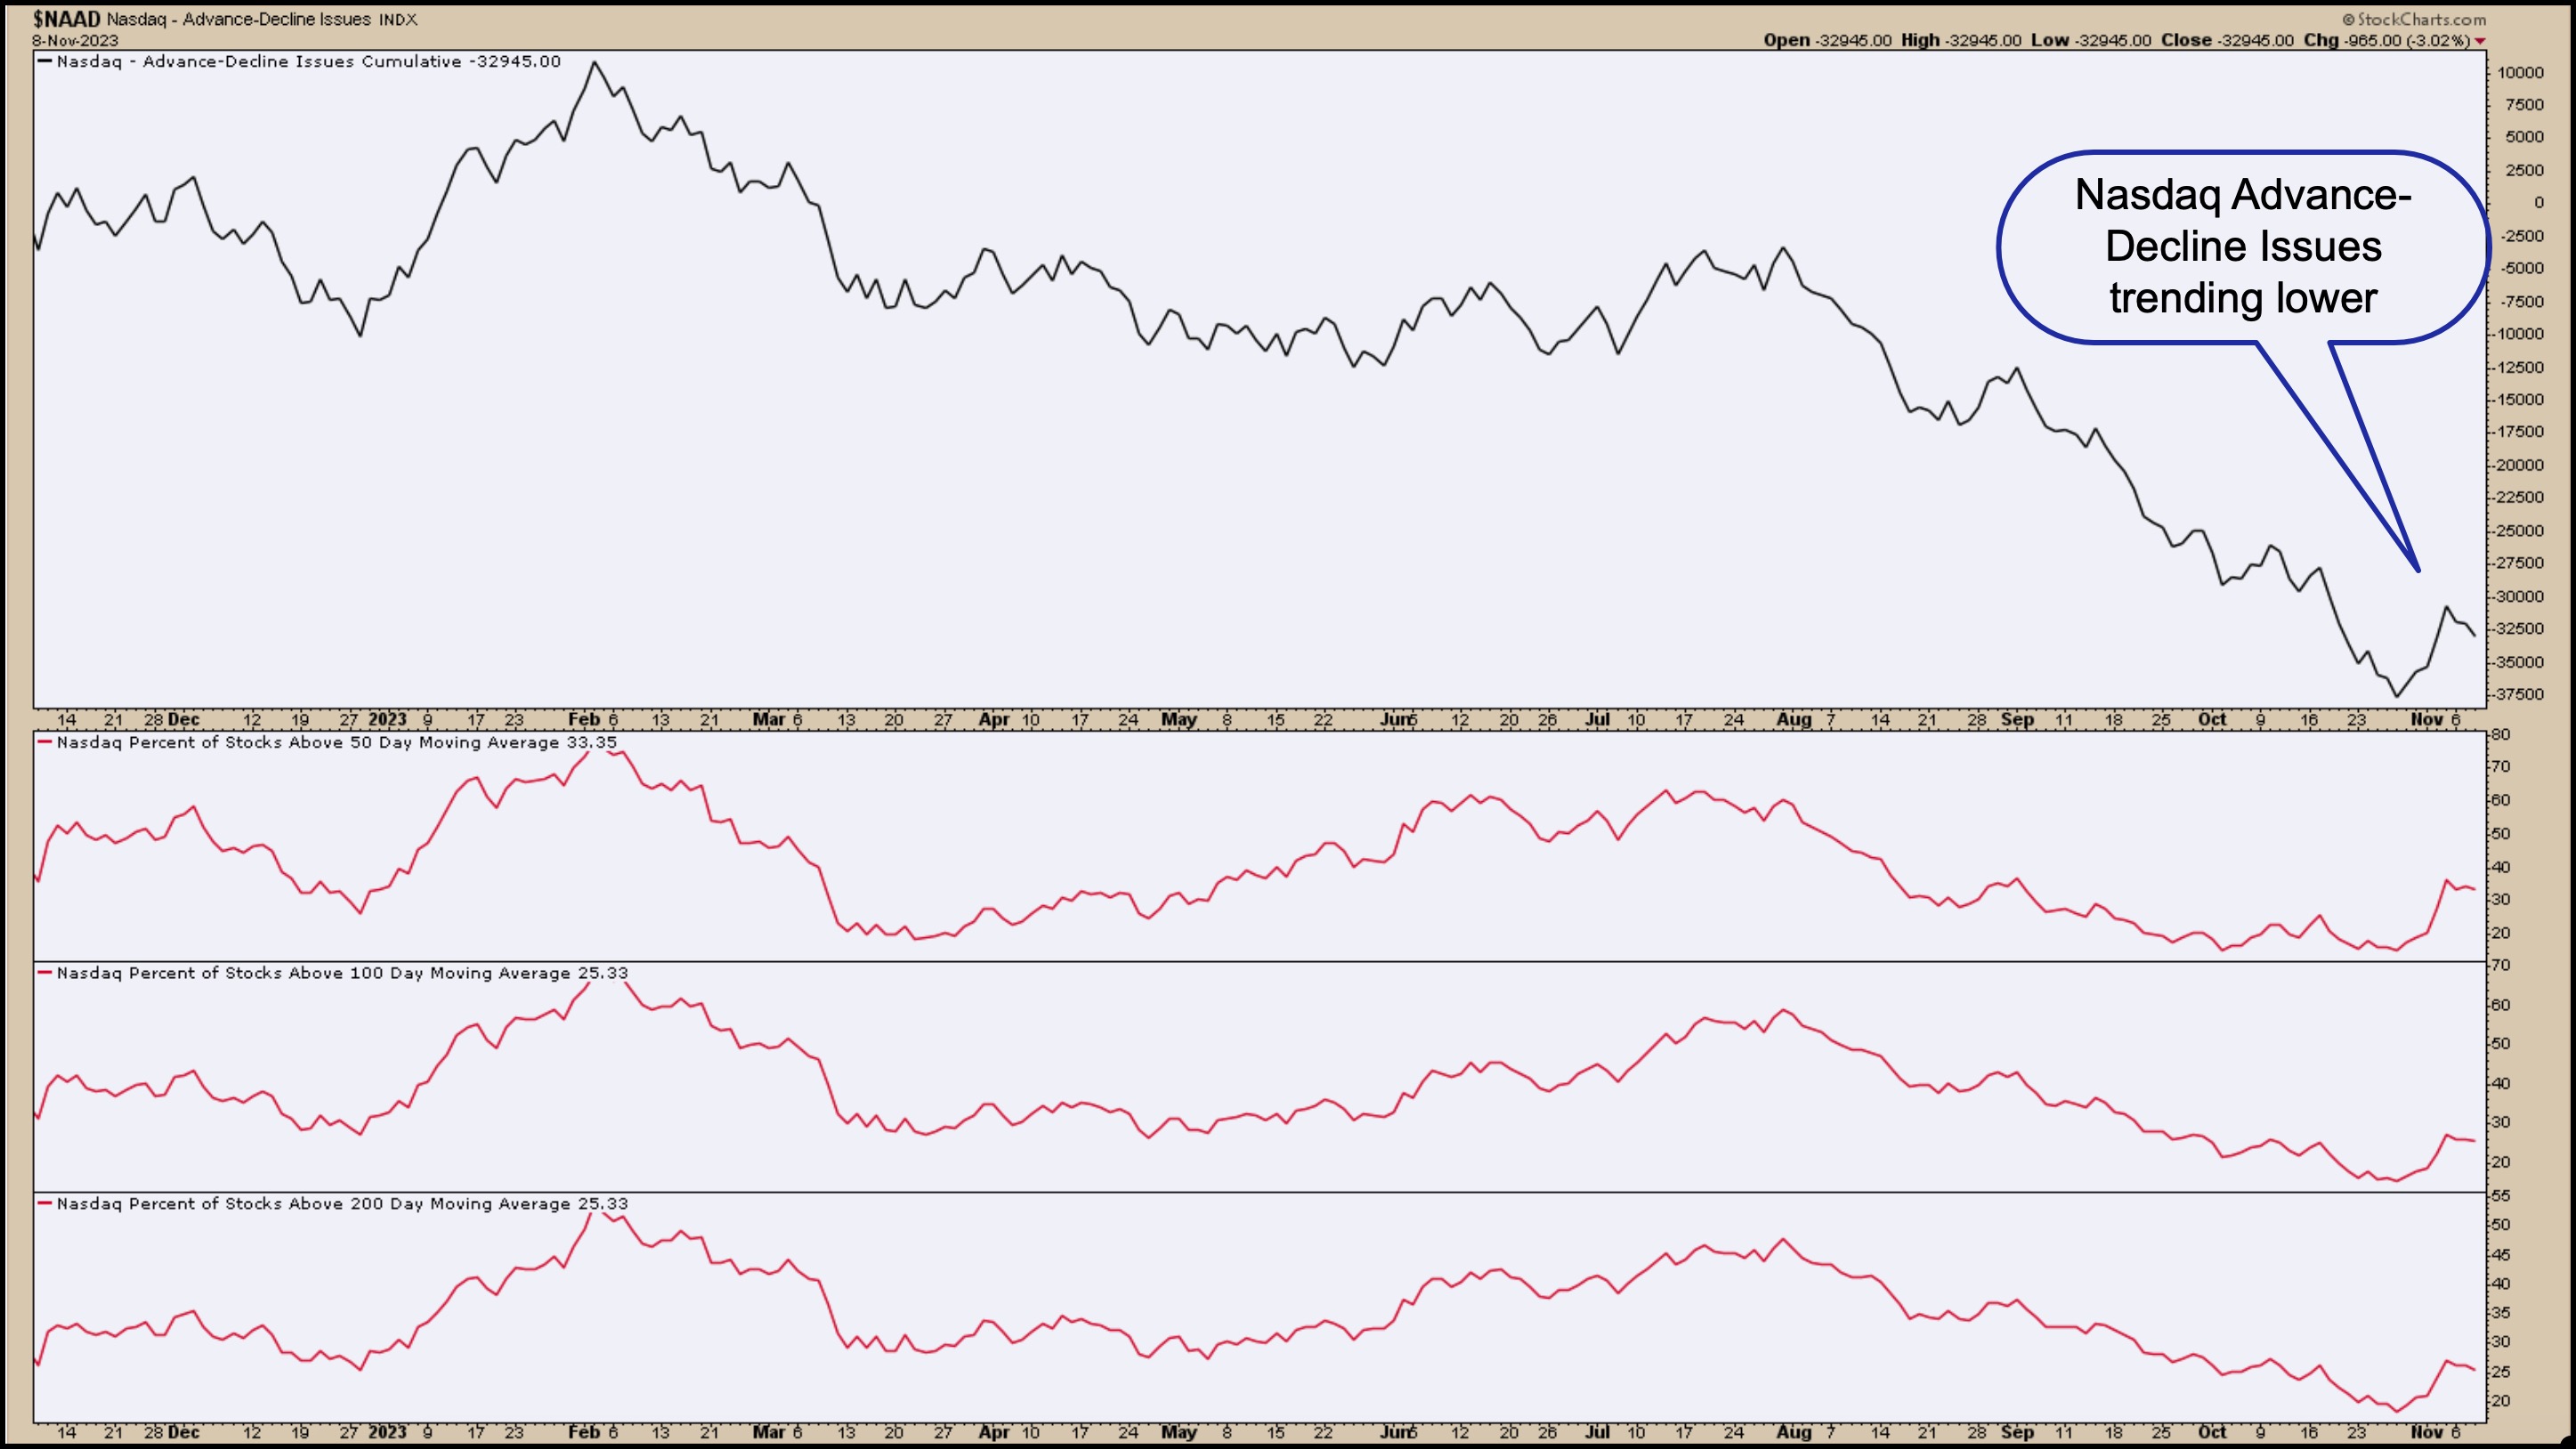
CHART 2: NASDAQ MARKET BREADTH IS STILL WEAK. The Nasdaq Composite completes its nine-day winning streak, but Advance-Decline issues are still weak, as are the percentages of stocks trading above their 50-, 100-, and 200-day moving averages. Chart source: StockCharts.com. For educational purposes.
The takeaway: We’re not out of the woods yet, so tread carefully.
A Slower Pace
While on the topic of fast-moving, crude oil prices have seen a dramatic fall since late September. Crude oil has fallen below its 200-day SMA, indicating that the economy is experiencing a slowdown. And a slower economy correlates with declining Treasury yields.
Poise and patience are the close friends of successful traders.
Talking about slowing down, it’s worth turning your attention to the CBOE Volatility Index ($VIX). The VIX looked like it might climb higher than the 20 level, a threshold for a change in market sentiment in the prevailing volatility regime. But, as equities started to climb higher, the VIX fell, suggesting that investors were much more at ease.
Does the overall slowing down mean that we’ll see a slower rise in equities?
In a recent episode of The Final Bar, our chief market strategist, David Keller, CMT, discussed the important levels to watch in the S&P 500. If the index breaks above 4400, it will break its downward sloping trendline, connecting the previous lower highs. This would be very positive for stocks. On the downside, the level to watch is 4200.
Let’s apply the similar levels Keller used in his chart of the S&P 500 with the Traffic Light indicator in StockCharts ACP. As you can see in the chart below, the S&P 500 is close to being in bull territory and breaking above its downward-sloping trendline that connects the lower highs. Like the Nasdaq, the S&P appears to be stalling as it comes close to a critical resistance level. This type of behavior is not atypical of the market. A break above resistance levels could mean a rally into the end of the year.
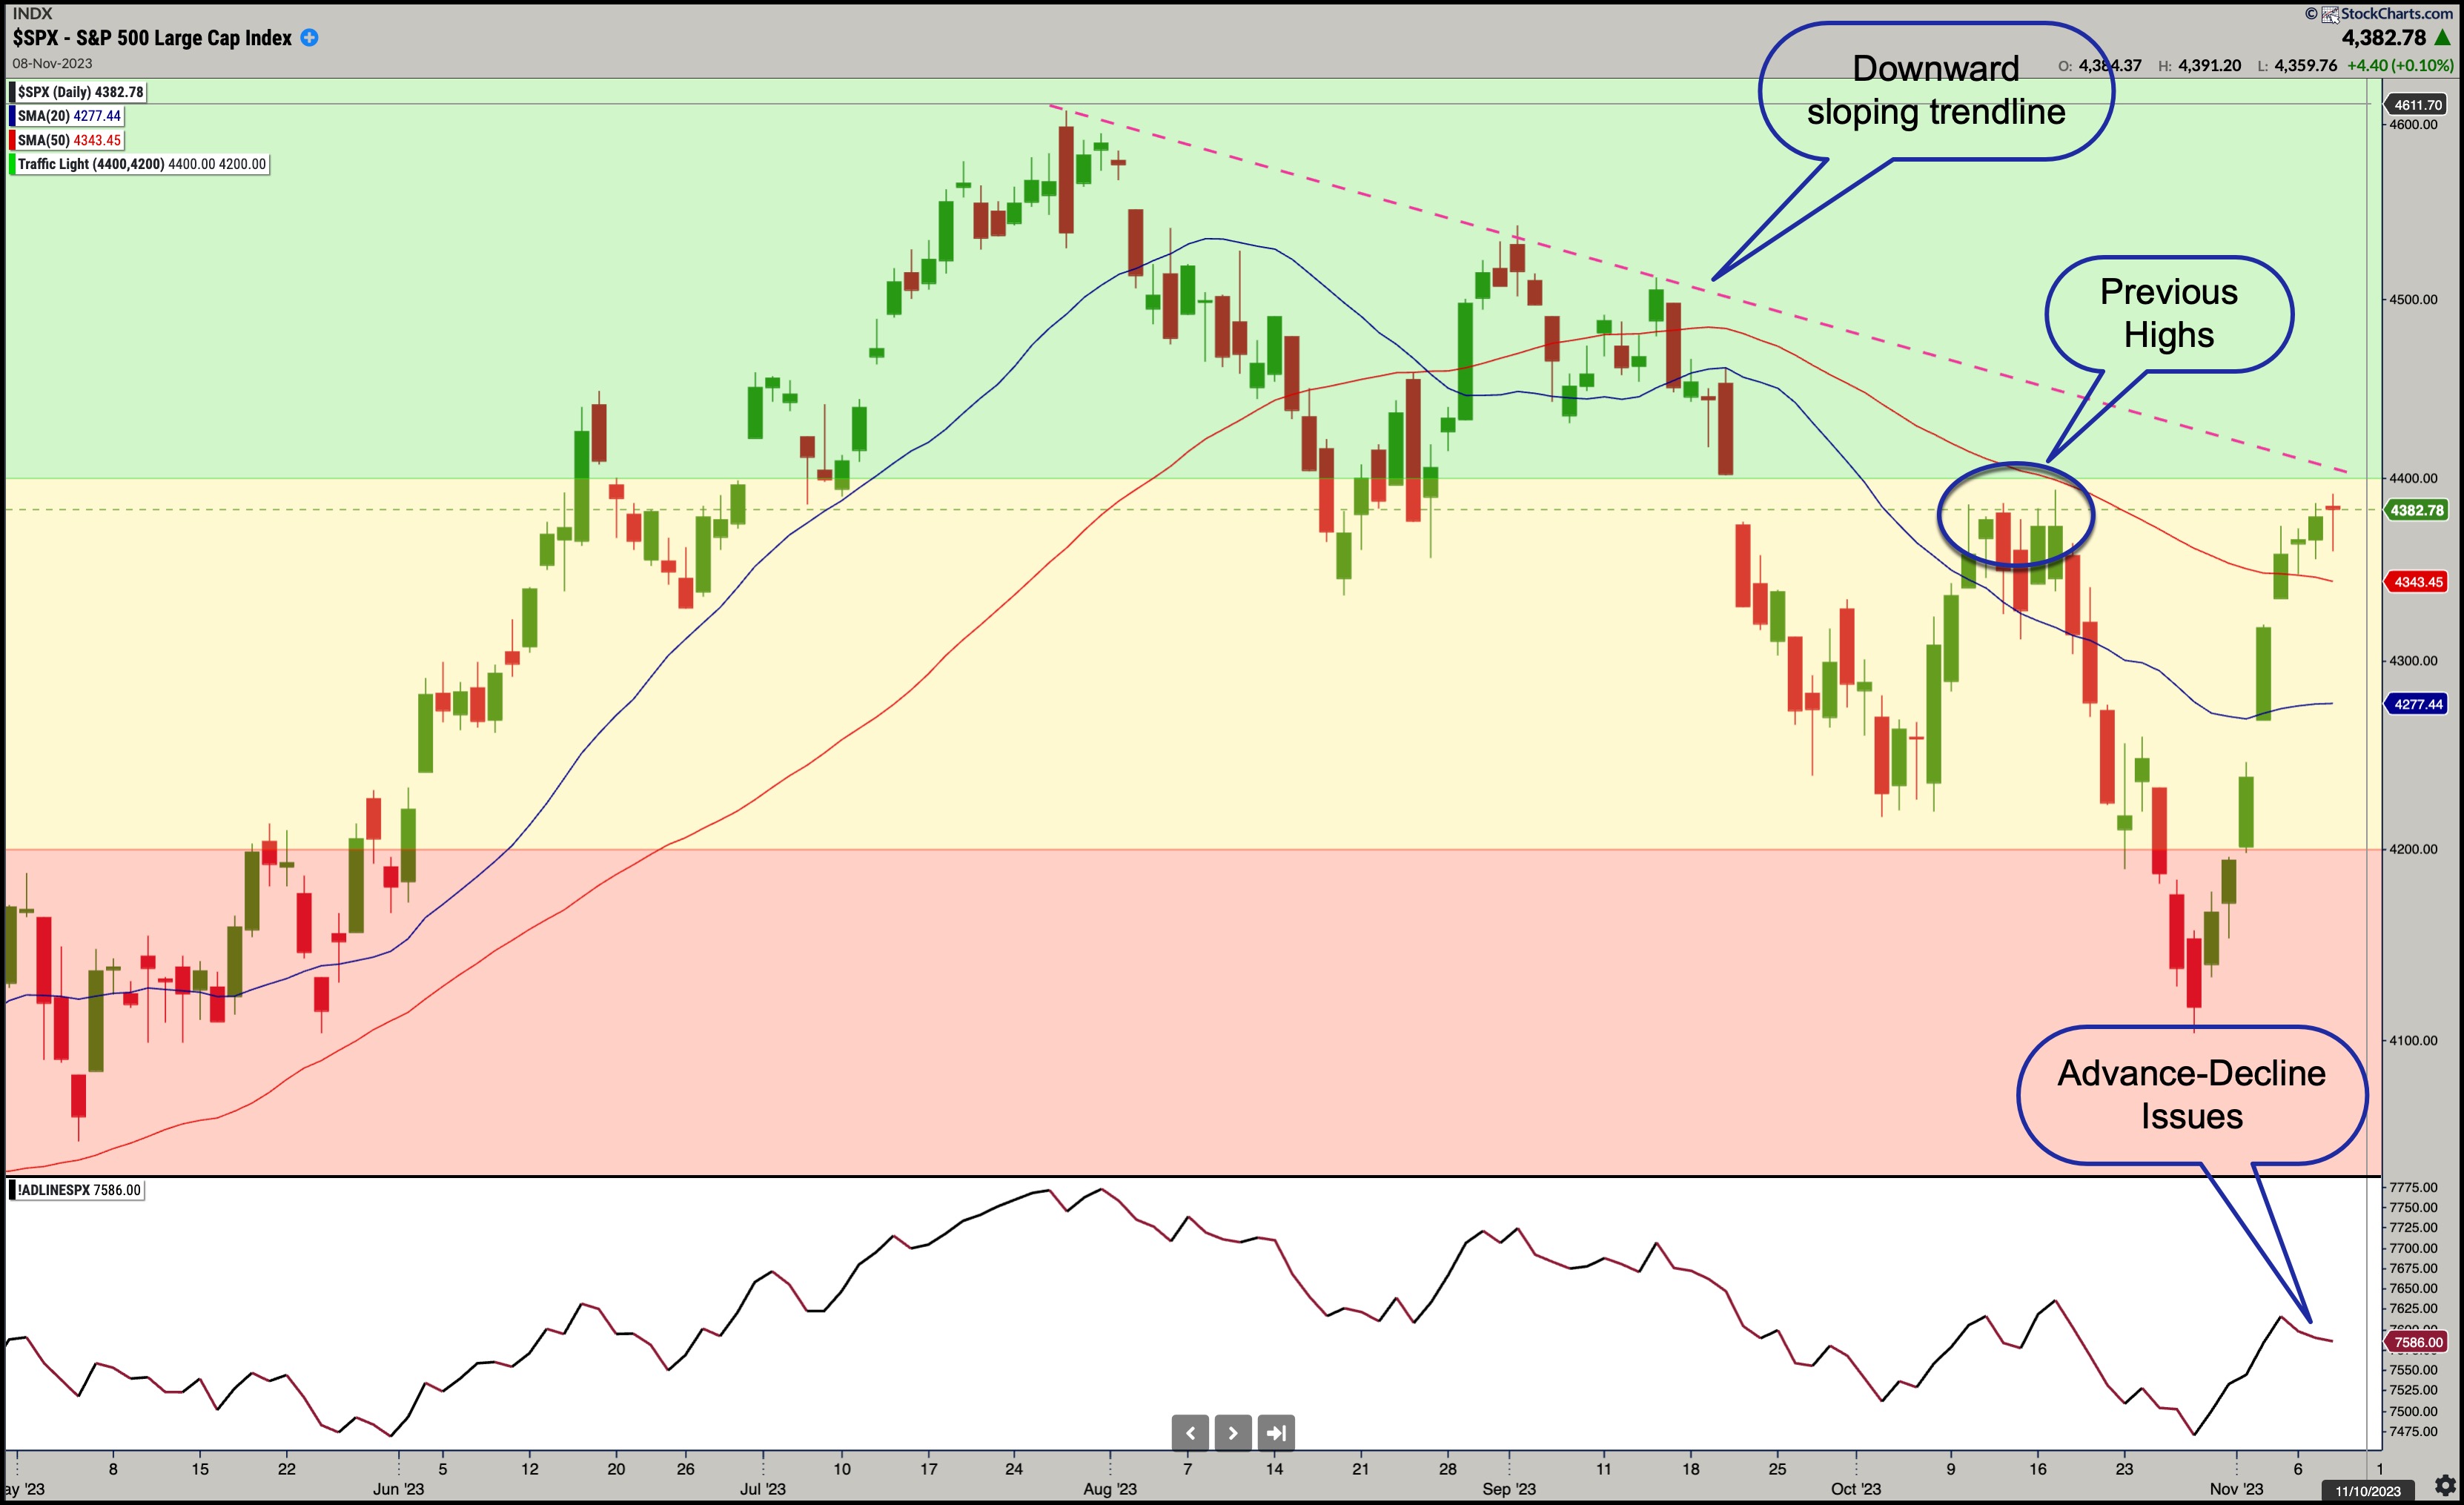
CHART 3: STOP, CAUTION, GO. The Traffic Light indicator shows the S&P 500 is close to a critical resistance level. A break above this level would be positive for equities.Chart source: StockChartsACP. For educational purposes.
It’s also a good idea to look at at least one market breadth indicator, such as the SPX Advance-Decline Line (lower panel in chart). It’s showing signs of slowing down as well.
Yes, it’s painful for investors still on the sidelines itching to jump in, but, as Jesse Livermore said, “Poise and patience are the close friends of successful traders.”
So, the big takeaway: Be patient. When the broader indexes confirm that the bull is here, it’s an opportunity to get back in the market. Keep an eye on the VIX, Treasury yields, and commodities. These can sometimes give early indications of changes in investor sentiment.

Disclaimer: This blog is for educational purposes only and should not be construed as financial advice. The ideas and strategies should never be used without first assessing your own personal and financial situation, or without consulting a financial professional.