First off, the markets have been testing the June lows for 6 days. Does this eventually give way, or do we hold? There’s no shortage of bad news out there; could this be the worst of the worst, and it gets marginally better from here?
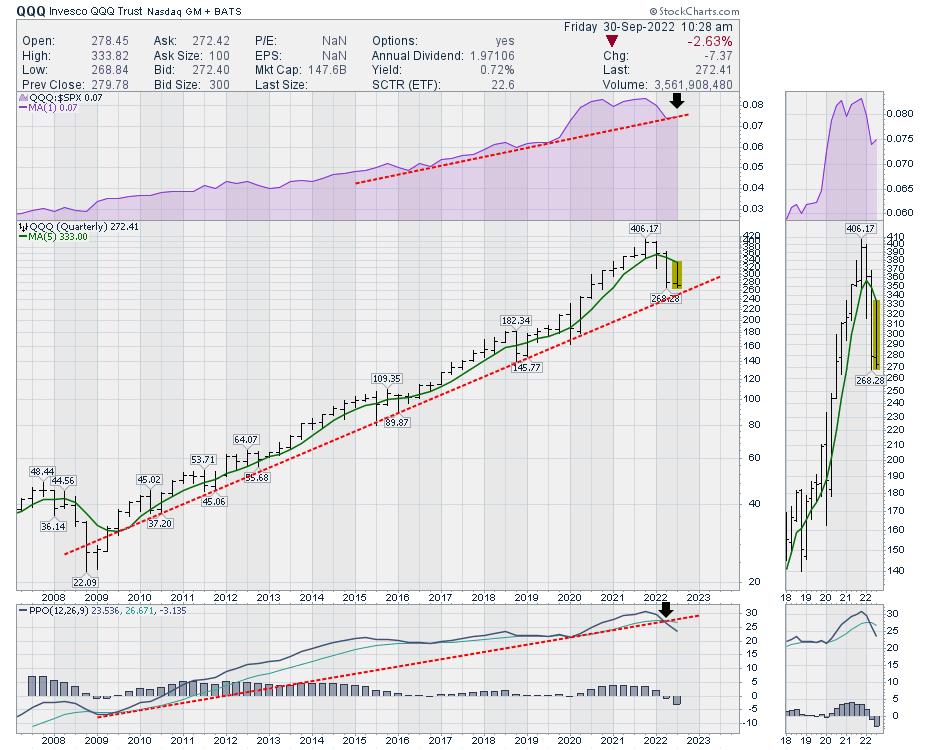
For the Nasdaq 100, ending the 3rd quarter on the bottom of the quarterly price bar sure doesn’t look good. I notice the relative strength trend of the QQQ, compared to the $SPX in purple, is testing the trend line this quarter. We have not seen the Nasdaq 100 underperform the $SPX so significantly in the last 14 years. Look at the size of the drop over the last three quarters.
I have a 5-quarter moving average line in green that has rolled over for the first time since 2008. The PPO has broken the uptrend.
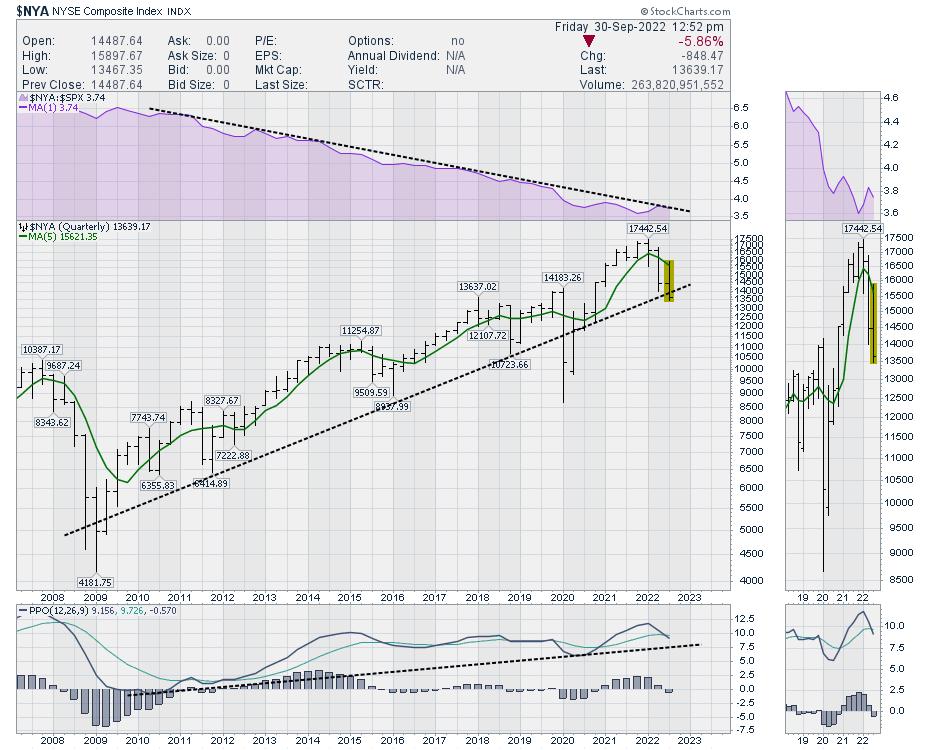
There is also the $NYA Composite, which covers the action for the entire NYSE market. The market composite typically underperforms the S&P 500, so that is not new, as shown in purple. However, this chart looks ready to close below the line. This line represents the economic uptrend we have been in since 2009.
Nine months ago, there was a huge amount of optimism as the indexes were in the top right corner. This video turned out to be very prescient. Did I get all the calls right? No, some charts changed direction. But we developed an expected plan from technicals and it played out.
FOr
Influential Events Of 2021
For fans of technical analysis, this will be a comforting video. For fans of fundamental analysis, this might work as an introduction to why technicals can help the investment focus.
Next week, we’ll get the opportunity to see 17 technical analysts give us a view towards the fourth quarter at ChartCon 2022.
ChartCon 2022
In particular, I am going to be putting out some of my best charts on the outlook for the fourth quarter!
I hope you get some insights and ideas from the conference. There is something special when you get a strong overview of the markets after 11 months pointing lower from 17 analysts. These analysts are some of the best in the business! Technicians will be noticing the changes long before the fundamentals start to improve.