KEY
TAKEAWAYS
- Growth and Value are moving together in an unusual rotation
- Money from large-cap stocks being distributed into mid- and small-cap segments
- Even all Mag7 names dropping in price is not enough to pull down benchmark indices
Something strange
Or at least unusual is going on.
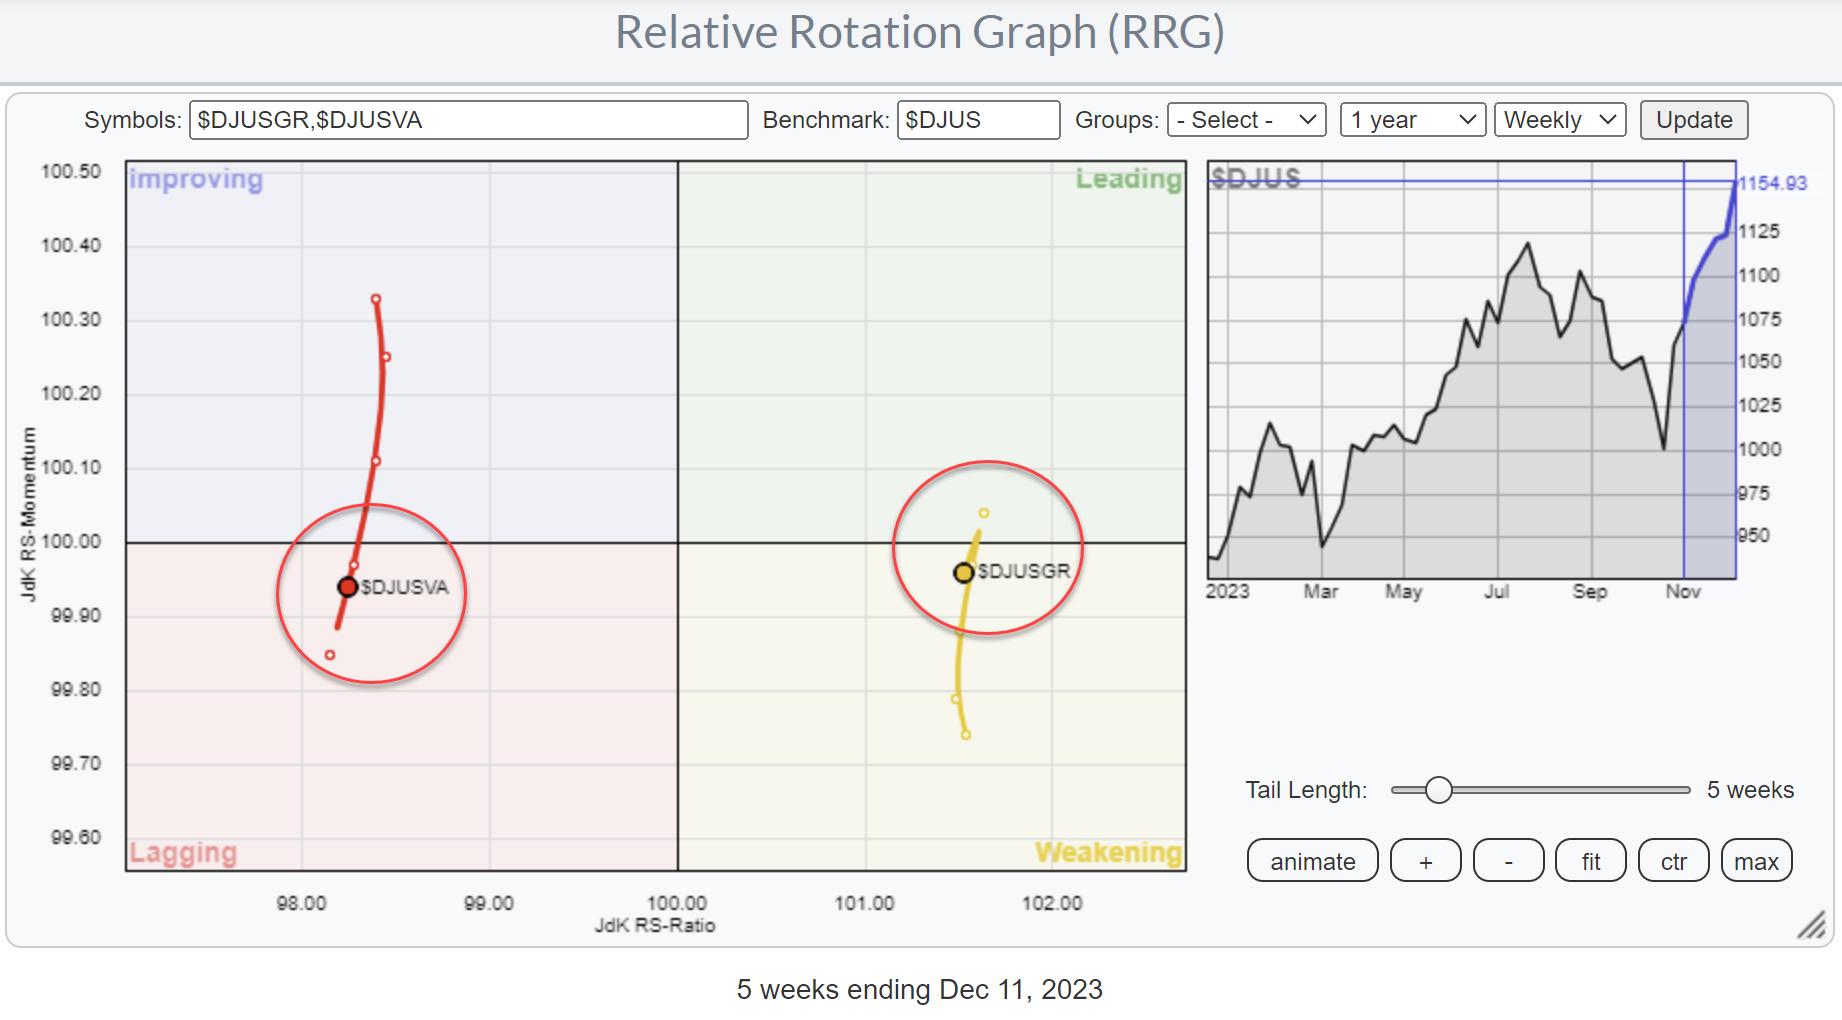
On the Relative Rotation Graph above the tails for the DJ US Value index and DJ US Growth index are plotted against the DJ US index. Usually, we see very gradual rotation in opposite directions which helps us to understand and track the direction of money moving from growth to value and vice versa.
Until a week or so ago the tails in the RRG above were very clearly and very gradually moving in opposite directions. And then all of a sudden there was this almost vertical hook almost 1-1 tracing back on the previous part of the tail.
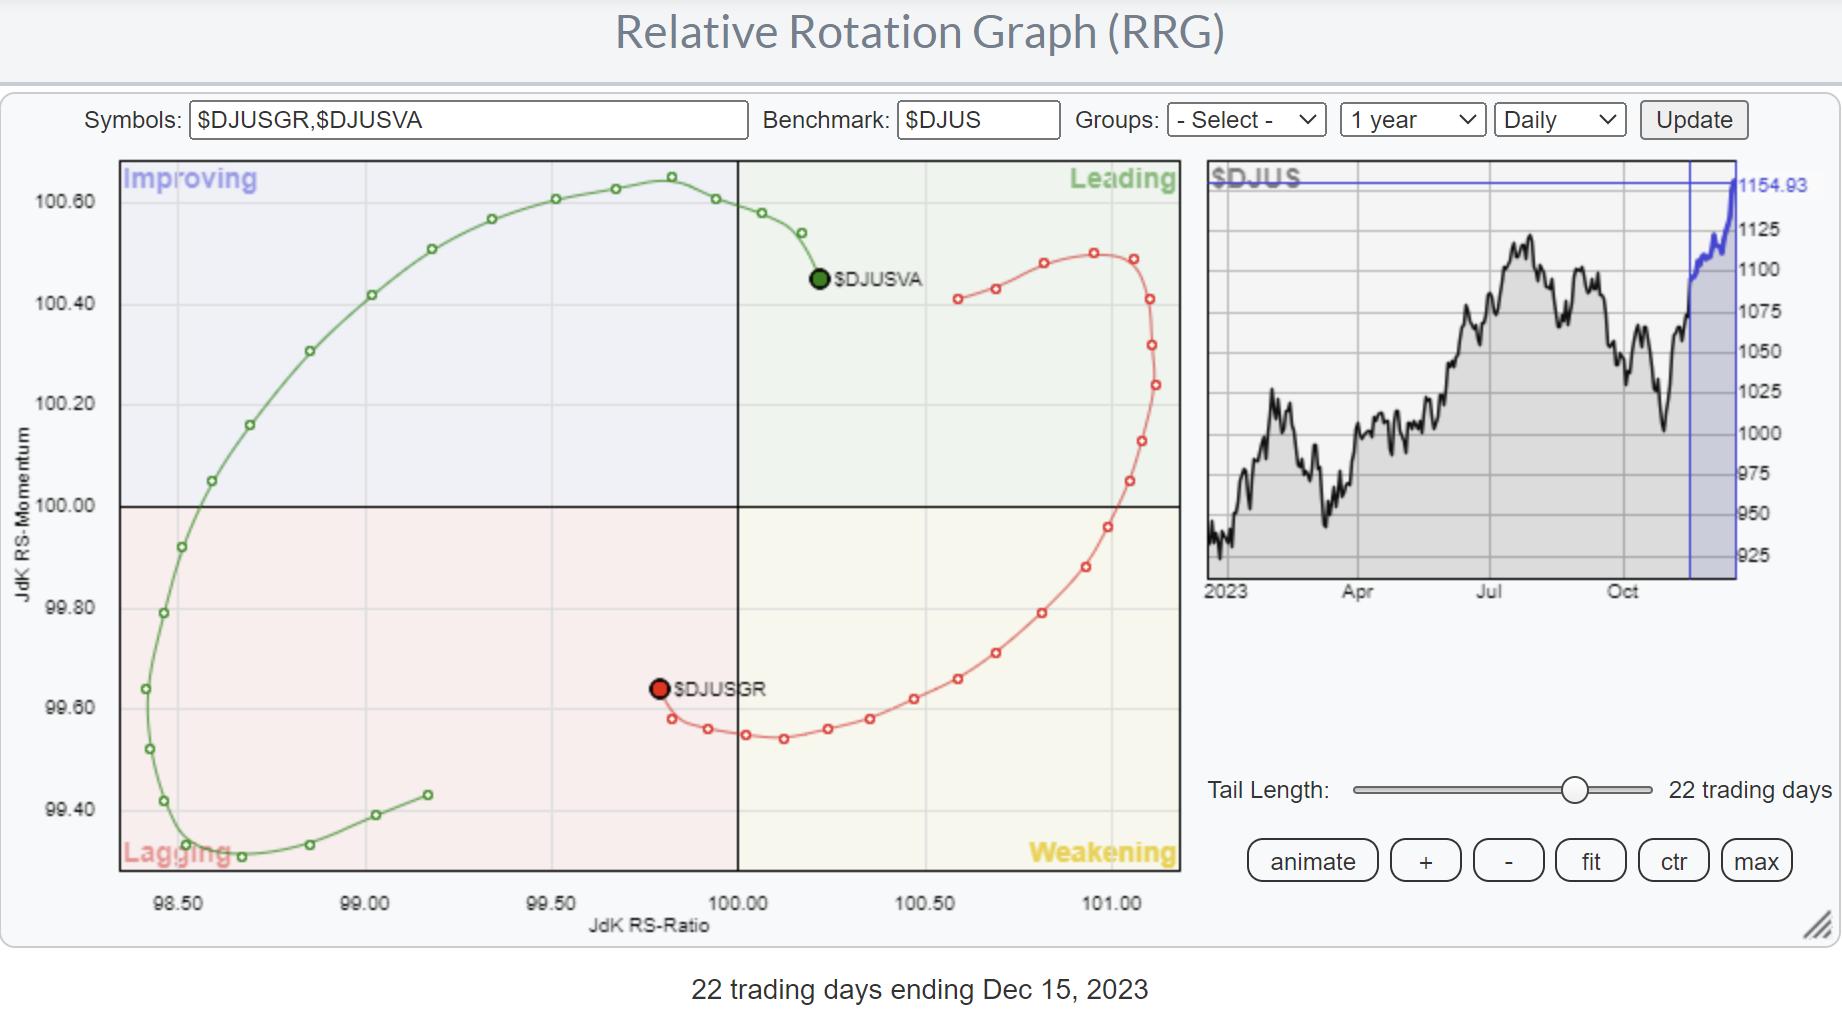
When zooming in on that move by switching to a daily RRG we see that there was an actual clockwise rotation (there always is) but it only becomes visible on a more granular chart because it was so swift. These larger rotations, and by large I mean at a higher level like asset classes, style, macro rotations, etc. usually take their time to move through their cycles. Not this time…
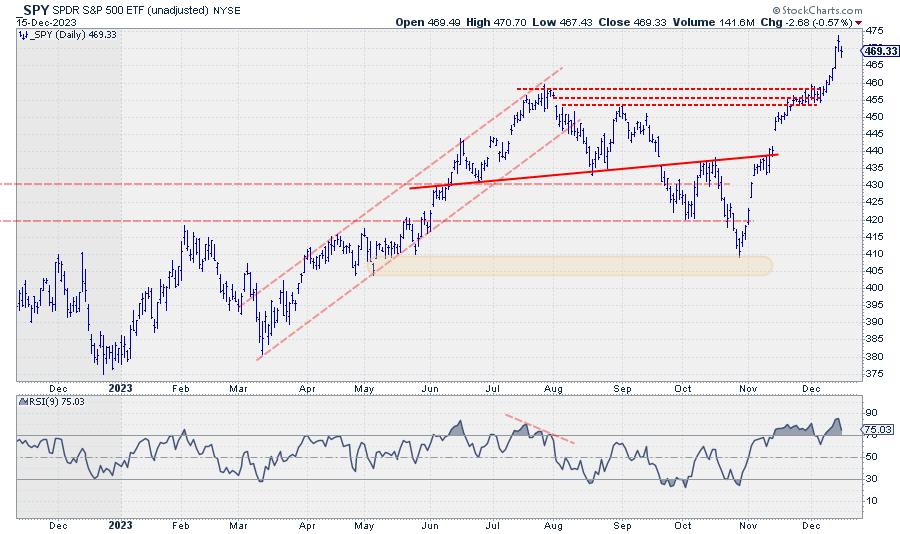
Mag7 Pullback does not take market lower.
We have all heard and/or witnessed the abrupt stalling of the Mag7 stocks, even leading to a day where all Mag7 stocks were down for the day but the market ($NDX) ended the day in positive territory. Interesting situation! It means that the money coming out of the Mag7 stocks was not pulled from the market. If that were the case the market in general would have down also. But rather has been redistributed to other, lower-tier, stocks in the market. Money has been rotating away from the Mag7 into other stocks in the same sectors/segments.
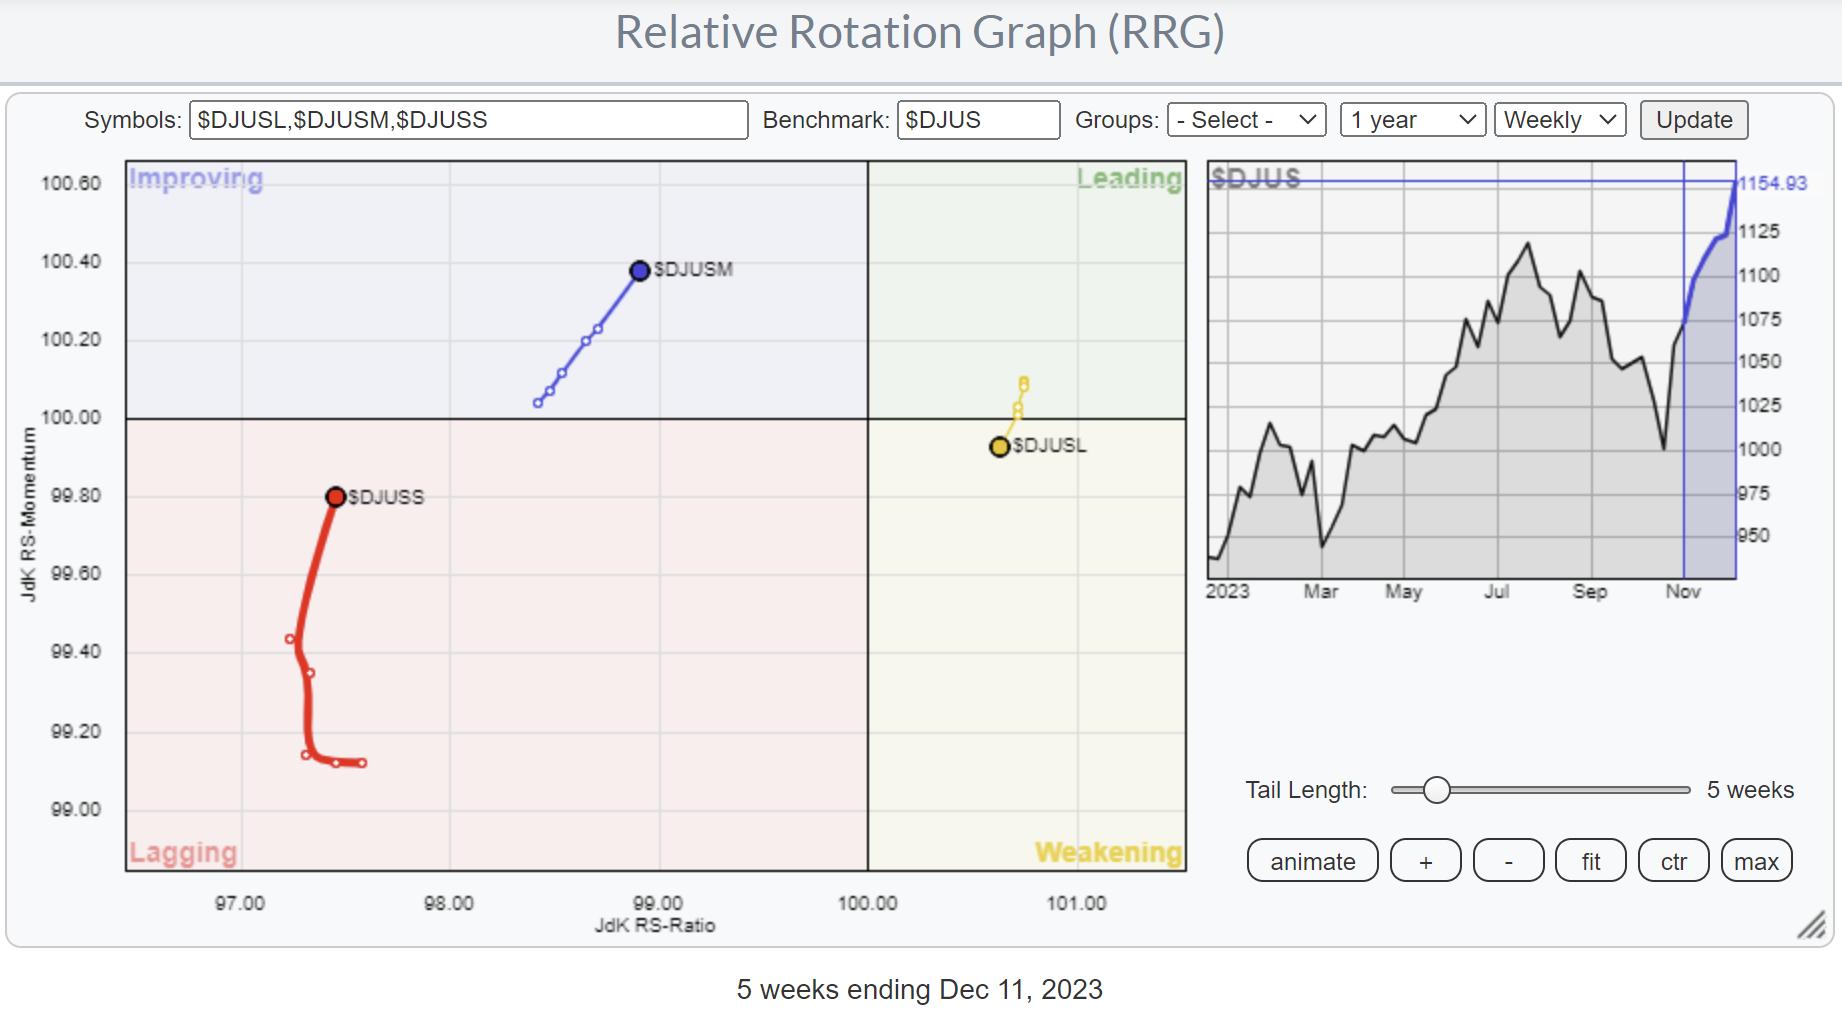
The RRG that shows the rotation for the Large- / Mid- / and Small-Cap segments perfectly visualizes that rotation. Large caps ($DJUSL) are moving from leading into weakening and traveling at a negative RRG-Heading. Mid-caps ($DJUSM) inside improving, and Small-caps ($DJUSS) inside lagging, have turned their tails into a positive RRG-Heading and they are accelerating which can be observed by looking at the RRG-velocity, the distance between the nodes on the tails.
So far this is not a strange rotation but when combined with the Style hooks in the RRG above it is “unusual”.
Size Rotation is Overpowering Style.
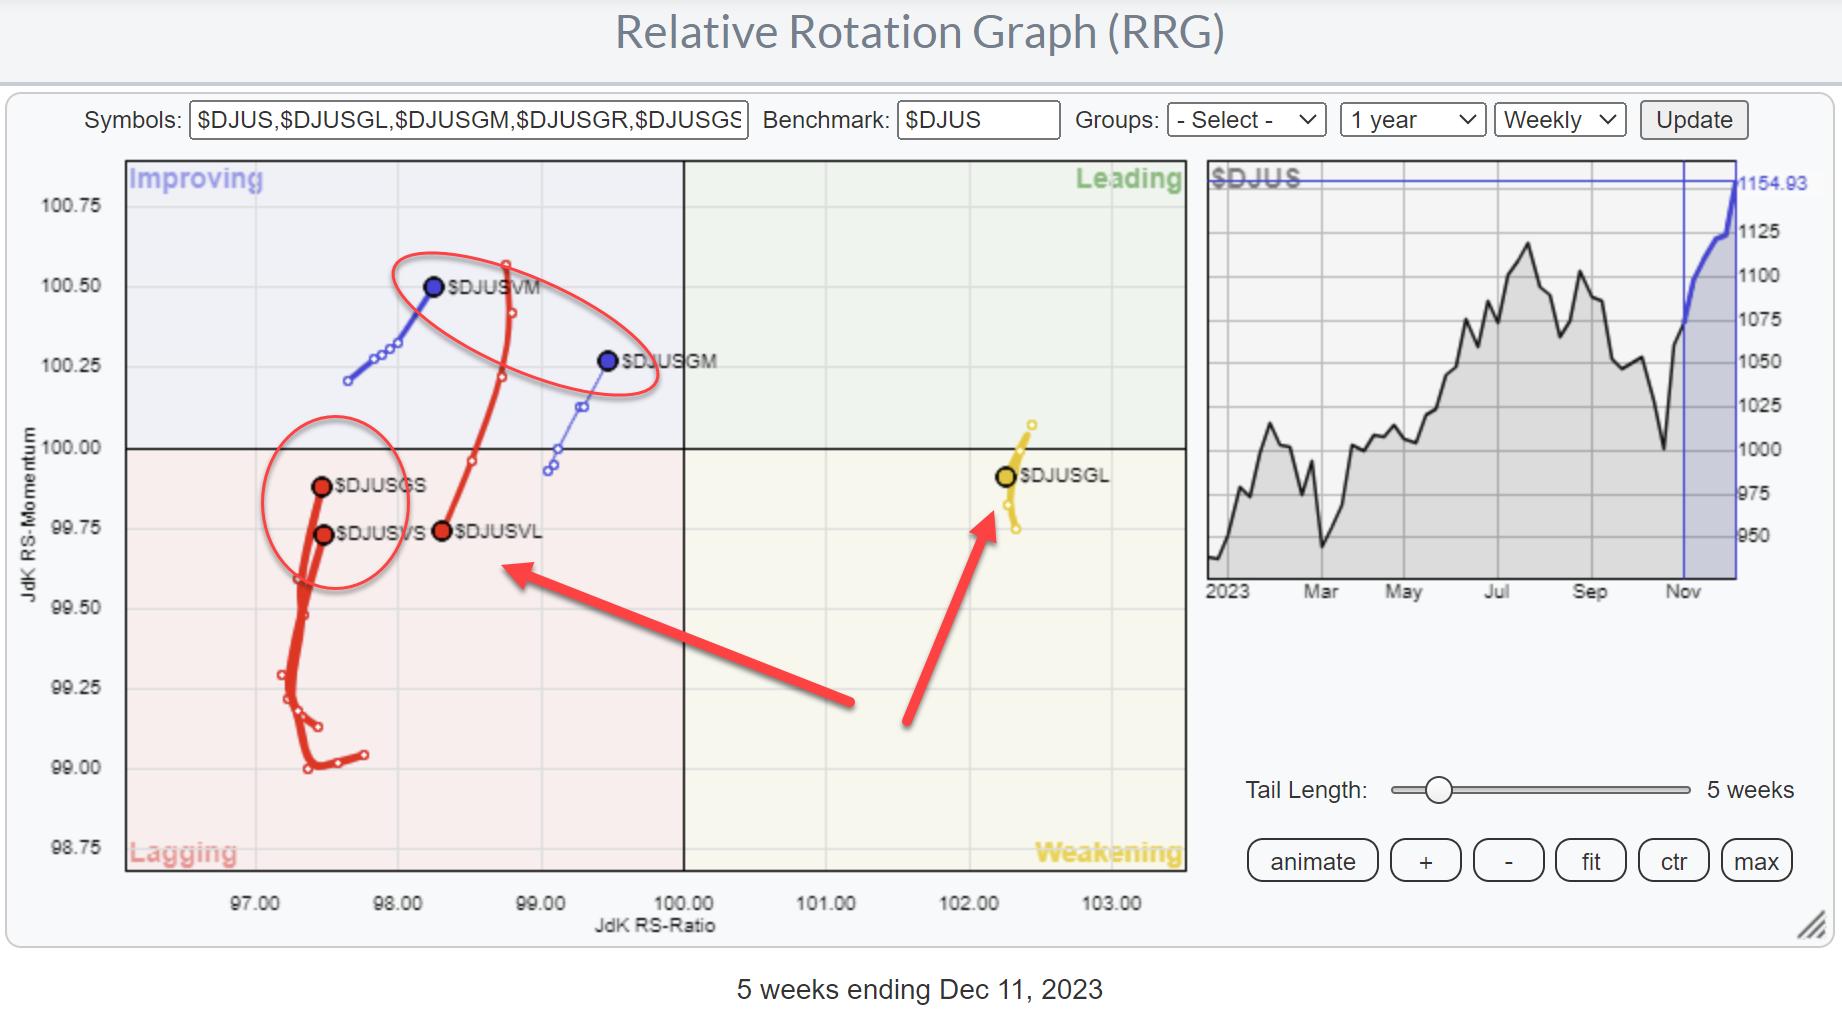
What’s happening under the hood, becomes clear when we bring up the RRG that breaks down the style indices into their different size buckets.
On the RRG above pay attention to the DJ Value Large and DJ Growth Large indices (pointing arrows). They are BOTH moving at a negative RRG-heading.
But also look at the $DJUSGS and $DJUSVS inside the lagging quadrant. Small-cap value and small-cap growth are BOTH moving higher. Same for Mid-cap value and mid-cap growth inside the improving quadrant. BOTH moving up and at a positive RRG-heading.
So Value and growth stocks are moving in the same direction regardless of their market capitalization while the market ($DJUS, $SPX, $NDX, etc) is continuing to move higher.
The conclusion therefore has to be that money is currently rotating out of large-cap stocks into small- and mid-caps, and it is doing that regardless of style (value growth).
While the markets are still edging higher it additionally means that the participation in the uptrend is broadening which is a good thing.
I doubt whether we will be able to keep up the current pace and we may be facing some setbacks but the longer-term trend in the market remains up with a foundation that is getting stronger.
Happy Holidays and a prosperous start to the new year from downtown Seattle. –Julius
Julius de Kempenaer
Senior Technical Analyst, StockCharts.com
Creator, Relative Rotation Graphs
Founder, RRG Research
Host of: Sector Spotlight
Please find my handles for social media channels under the Bio below.
Feedback, comments or questions are welcome at Juliusdk@stockcharts.com. I cannot promise to respond to each and every message, but I will certainly read them and, where reasonably possible, use the feedback and comments or answer questions.
To discuss RRG with me on S.C.A.N., tag me using the handle Julius_RRG.
RRG, Relative Rotation Graphs, JdK RS-Ratio, and JdK RS-Momentum are registered trademarks of RRG Research.