(Below is an excerpt from the subscriber-only DecisionPoint Alert on DecisionPoint.com for Thursday, 1/4):
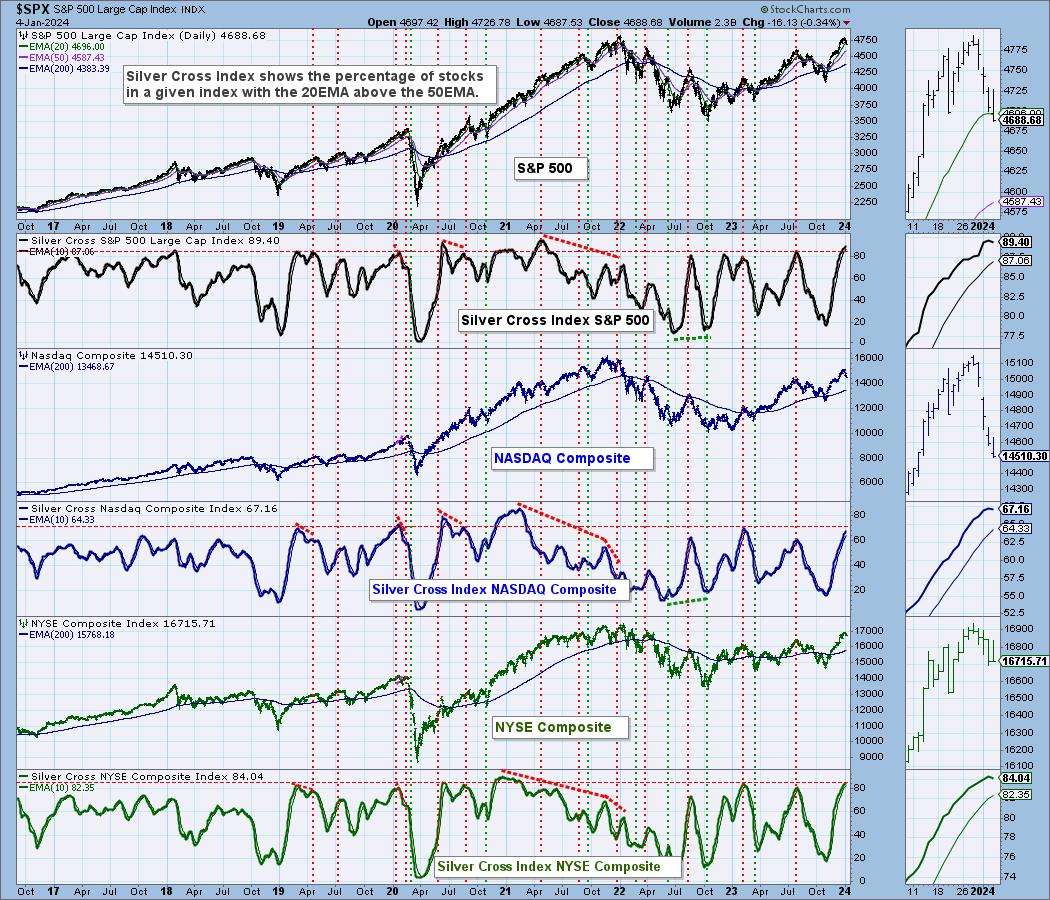
Most are familiar with what a “golden cross” is, a 50-day MA moving above the 200-day MA. Today we will talk about a “silver cross”. A “silver cross” is when the 20-day MA crosses above the 50-day MA. Stocks with a 20-day MA above the 50-day MA have bullish biases in the intermediate term.
We came up with the Silver Cross Index which measures how many stocks have a silver cross or a bullish IT bias. When the Silver Cross Index is above its signal line, we have a bullish IT bias.
Thursday the Silver Cross Index for the S&P500 topped and we noticed it wasn’t the only one. In the chart below you can see that the Nasdaq and NYSE Silver Cross Indexes also topped.
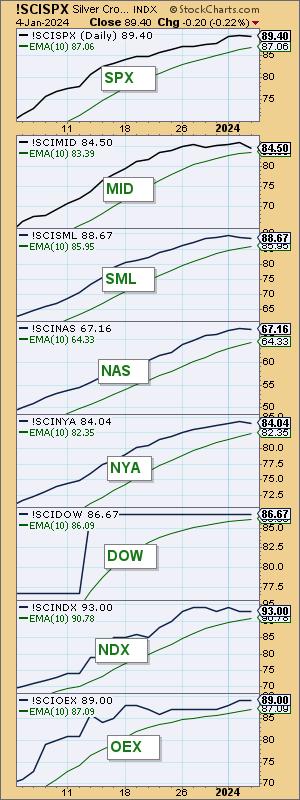
Here is a chart of all of the market indexes we cover. You can see that all but the Dow Industrials and OEX have topped. The Dow and NDX held the same readings, but both look toppy.
Conclusion: While the intermediate-term biases remain bullish given the Silver Cross Indexes are above their signal lines, deterioration is being detected and should keep us alert to broader weakness within the market.
Learn more about DecisionPoint.com:
Watch the latest episode of DecisionPoint on StockCharts TV’s YouTube channel here!

Try us out for two weeks with a trial subscription!
Use coupon code: DPTRIAL2 at checkout!
Technical Analysis is a windsock, not a crystal ball. –Carl Swenlin
(c) Copyright 2024 DecisionPoint.com
Disclaimer: This blog is for educational purposes only and should not be construed as financial advice. The ideas and strategies should never be used without first assessing your own personal and financial situation, or without consulting a financial professional. Any opinions expressed herein are solely those of the author, and do not in any way represent the views or opinions of any other person or entity.
DecisionPoint is not a registered investment advisor. Investment and trading decisions are solely your responsibility. DecisionPoint newsletters, blogs or website materials should NOT be interpreted as a recommendation or solicitation to buy or sell any security or to take any specific action.
Helpful DecisionPoint Links:
DecisionPoint Alert Chart List
DecisionPoint Golden Cross/Silver Cross Index Chart List
DecisionPoint Sector Chart List
Price Momentum Oscillator (PMO)
Swenlin Trading Oscillators (STO-B and STO-V)