A passage from the Outlook:
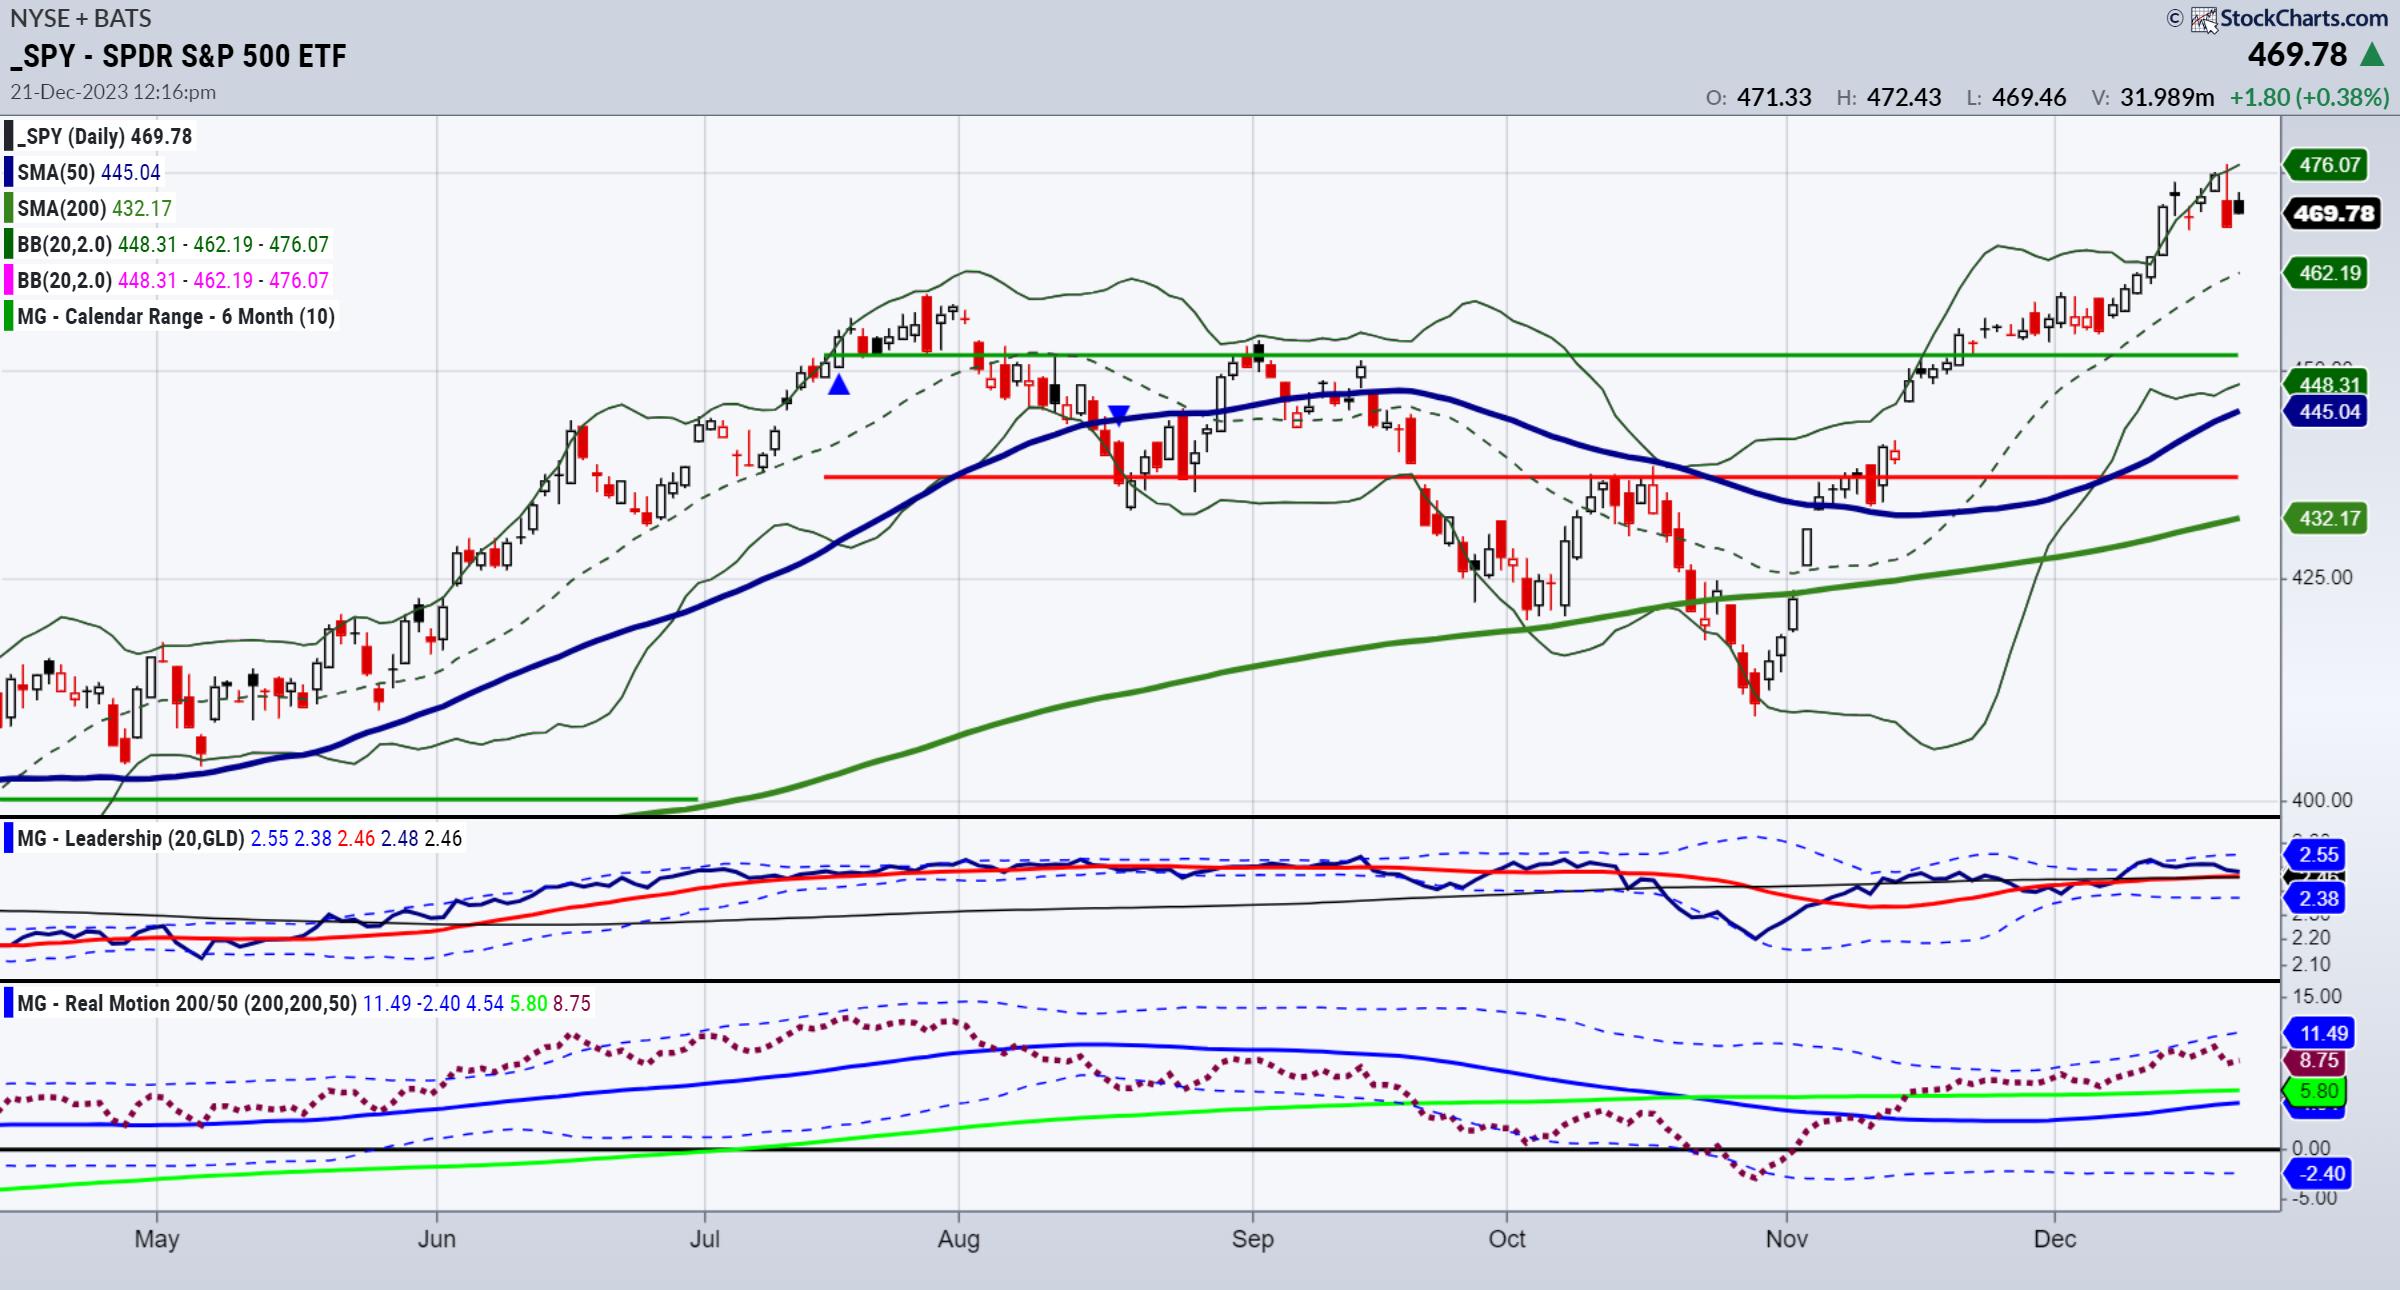
SPY’s all-time high was made in January 2022 at $479.98.
For now, the chart looks clear. If SPY pushes over 460, we can expect more upside at least until we get near the ATHs.
Should those levels clear, then we are in uncharted territory therefore it is hard to predict a target.
On the flipside, $415 is a clear line in the sand of support.
That statement was from December 1st. Here are some updated thoughts to add to the great content of the Outlook (which we highly recommend you get your free copy of).
December 22nd is the start date of a Santa Claus Rally. (last 5 trading days) However…
If Santa Claus should fail to call, bears may come to Broad and Wall.”
What does that mean for now? SPY gets close, but does not clear ATHs. Extreme greed hit recently along with record inflows. Folks are convinced the Fed will lower rates in 2024. All positives got too ahead of themselves.
Some of our predictions? If at the close of December, SPY closes under 470, January and 460 is key and pivotal. If SPY just hangs in there and does not fail, then small caps and retail can shine.
Click this link to get your free copy of the Outlook 2024 and stay in the loop!
This is for educational purposes only. Trading comes with risk.
If you find it difficult to execute the MarketGauge strategies or would like to explore how we can do it for you, please email Ben Scheibe at Benny@MGAMLLC.com, our Head of Institutional Sales. Cell: 612-518-2482.
For more detailed trading information about our blended models, tools and trader education courses, contact Rob Quinn, our Chief Strategy Consultant, to learn more.


Get your copy of Plant Your Money Tree: A Guide to Growing Your Wealth.
Grow your wealth today and plant your money tree!
 “I grew my money tree and so can you!” – Mish Schneider
Follow Mish on Twitter @marketminute for stock picks and more. Follow Mish on Instagram (mishschneider) for daily morning videos. To see updated media clips, click here.
Mish makes the case for Vaxcyte (PCVX) and presents the bullish case for gold in this appearance on Business First AM from November 29th.
Mish talksabout money supply, debt, the consumer, inflation and trends that could gain traction in 2024 with Nicole Petallides on Schwab Network.
On the Tuesday, November 28 edition of StockCharts TV’s Your Daily Five, Mish presents 6 stock picks with specific actionable plans.
Mish covers the technical setup for Palo Alto and how MarketGauge’s quant models found this winner on Business First AM.
Mish and Maggie Lake cover inflation, technology, commodities and stock picks in this interview with Real Vision.
Coming Up:
December 22: Yahoo! Finance
December 28: Singapore Breakfast Radio
January 2: The Final Bar with David Keller, StockCharts TV
January 5: Daily Briefing, Real Vision
Weekly: Business First AM, CMC Markets
- S&P 500 (SPY): 480 all-time highs, 465 underlying support.
- Russell 2000 (IWM) 200 pivotal and 194 support.
- Dow (DIA): Needs to hold 370.
- Nasdaq (QQQ): 410 resistance with support at 395.
- Regional Banks (KRE): 47 support 55 resistance.
- Semiconductors (SMH): 174 pivotal support to hold this month.
- Transportation (IYT): Needs to hold 250.
- Biotechnology (IBB): 130 pivotal support.
- Retail (XRT): Huge gap up last 2 days of the week that now needs to hold.
Mish Schneider
MarketGauge.com
Director of Trading Research and Education