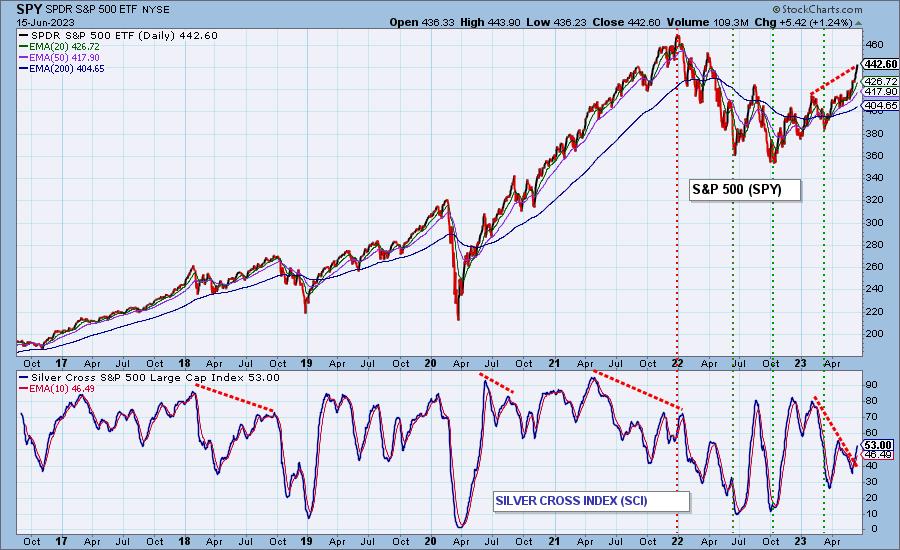
A Silver Cross is when a stock’s 20-day EMA crosses above the 50-day EMA, and that event rates the stock to be bullish in the intermediate term. DecisionPoint’s Silver Cross Index (SCI) expresses the percentage of stocks in the index that have a Silver Cross. We currently consider a Silver Cross Index reading of 50 percent or higher to be bullish for that price index. We normally report these readings on Friday, but as of today all the major indexes we track have SCI readings above 50 percent.
It would be too cumbersome to show all their charts, so for the purpose of illustration, here is the chart of the S&P 500 Index SPDR (SPY) with Silver Cross Index. There is still a considerable negative divergence versus price, but we think that is well on the way to being erased. And, conversely, there is plenty of room for improvement before overbought levels are reached.
Here is a truncated version of the weekly SCI table showing the major indexes in the top group, miscellaneous Industry Groups in the middle, and the 11 S&P 500 Sectors at the bottom. Note that all but Gold Miners have shown improvement this week, and all the major indexes have reached bull market participation levels of 50 percent or more. The QQQ reading of 70 percent reflects the problem with the rally, which is that the mega-cap tech stocks are primarily leading the charge.
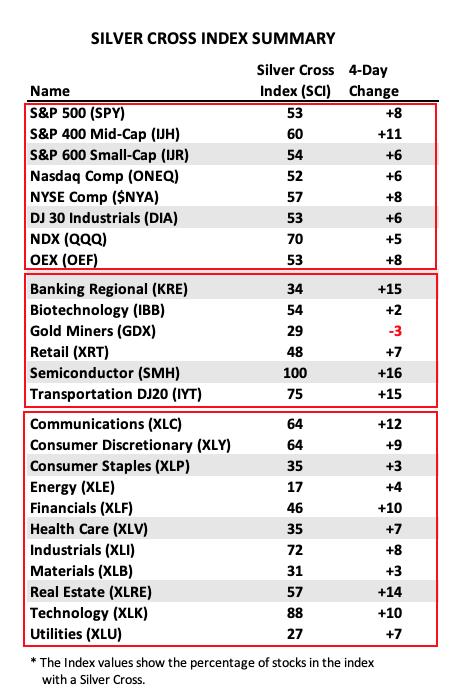
On the negative side, six of the 11 S&P 500 Sectors have not reached the SCI 50 percent reading yet, and half the Industry Groups are recalcitrant.
Conclusion: While mega-cap tech stocks are weighting the market indexes higher, we can see that other stocks are beginning to join the parade, and all the major indexes we track are at bull market participation levels.
Learn more about DecisionPoint.com:
Watch the latest episode of DecisionPoint on StockCharts TV’s YouTube channel here!

Technical Analysis is a windsock, not a crystal ball. –Carl Swenlin
(c) Copyright 2023 DecisionPoint.com
Helpful DecisionPoint Links:
DecisionPoint Alert Chart List
DecisionPoint Golden Cross/Silver Cross Index Chart List
DecisionPoint Sector Chart List
Price Momentum Oscillator (PMO)
Swenlin Trading Oscillators (STO-B and STO-V)
DecisionPoint is not a registered investment advisor. Investment and trading decisions are solely your responsibility. DecisionPoint newsletters, blogs or website materials should NOT be interpreted as a recommendation or solicitation to buy or sell any security or to take any specific action.