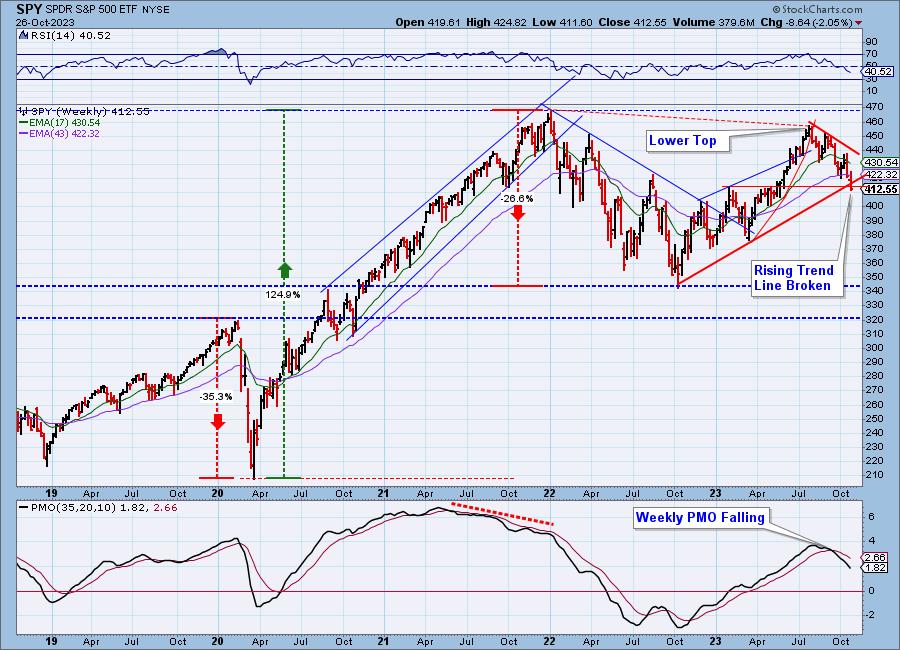
The S&P 500 (SPY) has fallen about 10 percent from the July top, and the last two weeks has been pretty rough, so should we be looking for the Bear to take charge again? First, looking at a weekly chart, it is not clear that the Bear actually left town. In spite of a great rally off the October 2022 low, the market top in July never actually exceed the January 2022 all-time high, so the current decline could be the next down leg of an ongoing bear market.
This next chart shows some of the best breadth indicators available. The Silver Cross Index (SCI) is an intermediate-term indicator that shows the percentage of stocks in the S&P 500 Index that have their 20-day EMA above their 50-day EMA. Currently that number is only 19%, meaning that 81% are in a negative configuration. The Golden Cross Index (GCI) is a long-term indicator that shows the percentage of stocks with their 50-day EMA above their 200-day EMA (commonly called a Golden Cross). That number is 44%, which on this indicator signifies a bear market.
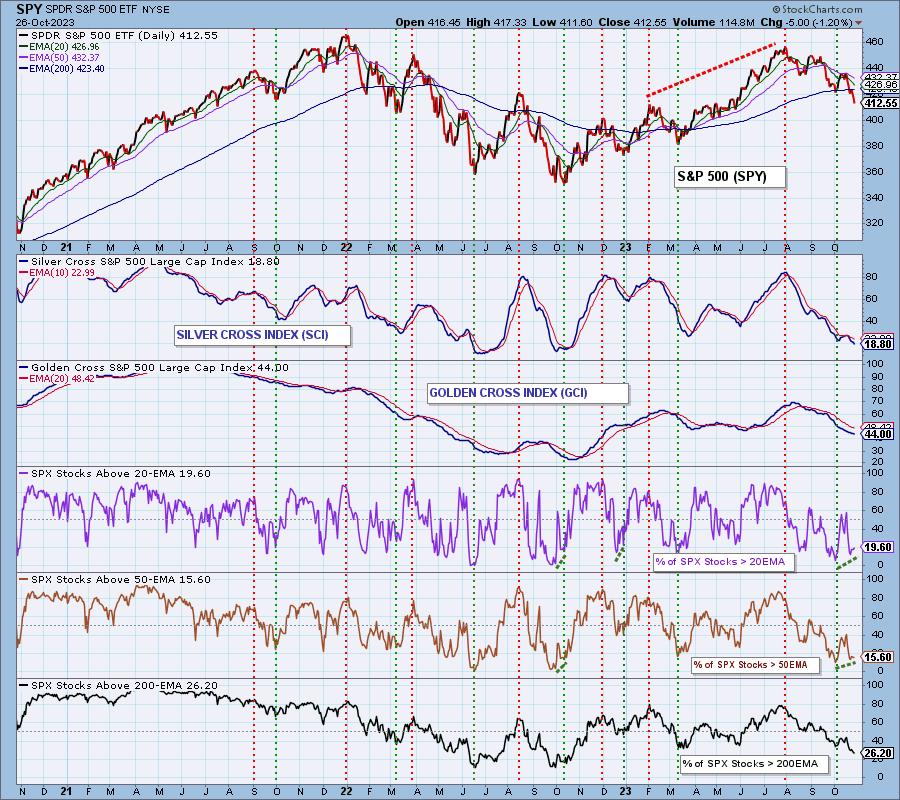
A minor, but maybe important, feature at the lower right corner of this chart may be the two rising dotted green lines drawn under the % SPX Stocks > 20EMA and % SPX Stocks > 50EMA which represent a positive divergence against price. These may be a hint that a bounce is in the cards.
Conclusion: Is the Bear back in town? Considering the lower long-term price top, it is not clear that he actually left. The fact that only 19% of S&P 500 stocks are positively configured (20-EMA above the 50-EMA) in the intermediate-term, the internals do not encourage positive thinking. The best thing we can say at this point is that the SCI is very oversold, and that offers hope of an upside reaction.
Learn more about DecisionPoint.com:
Watch the latest episode of DecisionPoint on StockCharts TV’s YouTube channel here!

Try us out for two weeks with a trial subscription!
Use coupon code: DPTRIAL2 at checkout!
Technical Analysis is a windsock, not a crystal ball. –Carl Swenlin
(c) Copyright 2023 DecisionPoint.com
Disclaimer: This blog is for educational purposes only and should not be construed as financial advice. The ideas and strategies should never be used without first assessing your own personal and financial situation, or without consulting a financial professional. Any opinions expressed herein are solely those of the author, and do not in any way represent the views or opinions of any other person or entity.
DecisionPoint is not a registered investment advisor. Investment and trading decisions are solely your responsibility. DecisionPoint newsletters, blogs or website materials should NOT be interpreted as a recommendation or solicitation to buy or sell any security or to take any specific action.
Helpful DecisionPoint Links:
DecisionPoint Alert Chart List
DecisionPoint Golden Cross/Silver Cross Index Chart List
DecisionPoint Sector Chart List
Price Momentum Oscillator (PMO)
Swenlin Trading Oscillators (STO-B and STO-V)