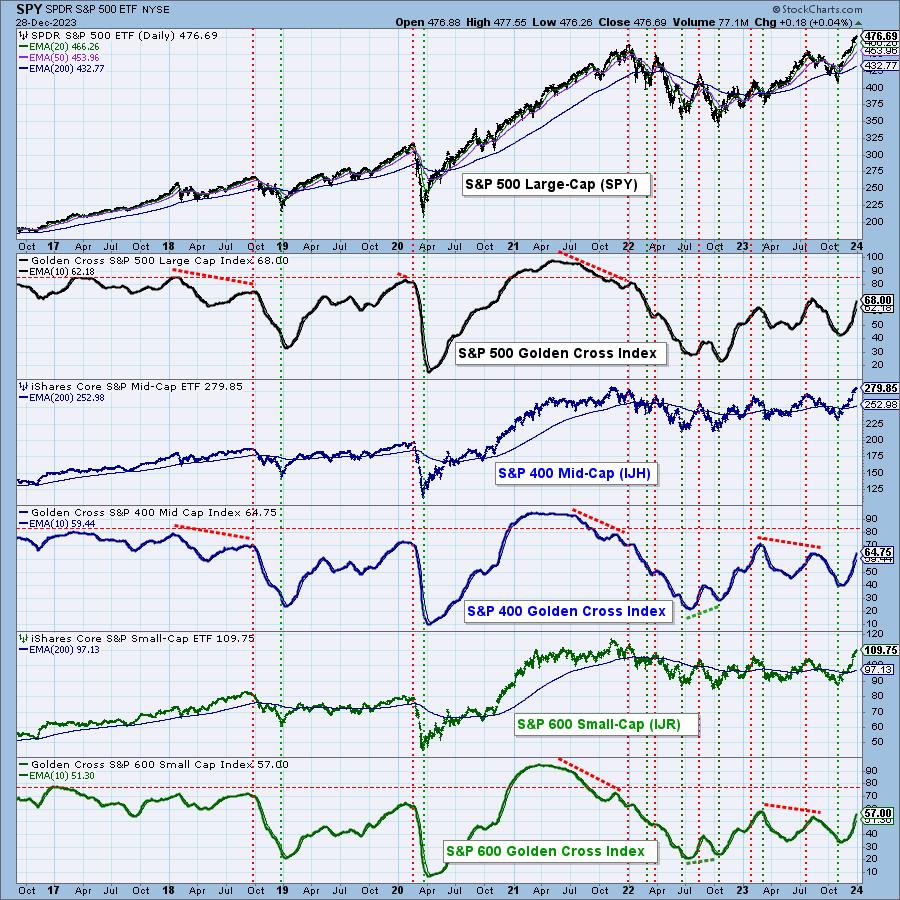
When we discuss participation we are referring to the more specific and accurate assessment of breadth available with the Golden Cross and Silver Cross Indexes. The venerable and widely known Golden Cross is when the 50-day moving average of a price index crosses up through the 200-day moving average, which signals a shift from long-term bearishness to long-term bullishness for the price index. (Note: We use exponential moving averages – EMAs.)
Taking this one step further, we have developed the Golden Cross Index, which is the percentage of stocks in a given index that have a Golden Cross. The chart below shows the ETFs for the S&P 500 Large-Cap, S&P 400 Mid-Cap, and S&P 600 Small-Cap Indexes with their respective Golden Cross Indexes (GCI). While the GCIs are all well above the bull market level of 50%, they are well below their bull market levels in 2021 of above 90%, even though their price indexes are at or near new, all-time highs. While they could continue to improve, we must take it as a negative sign that long-term participation is so poor.
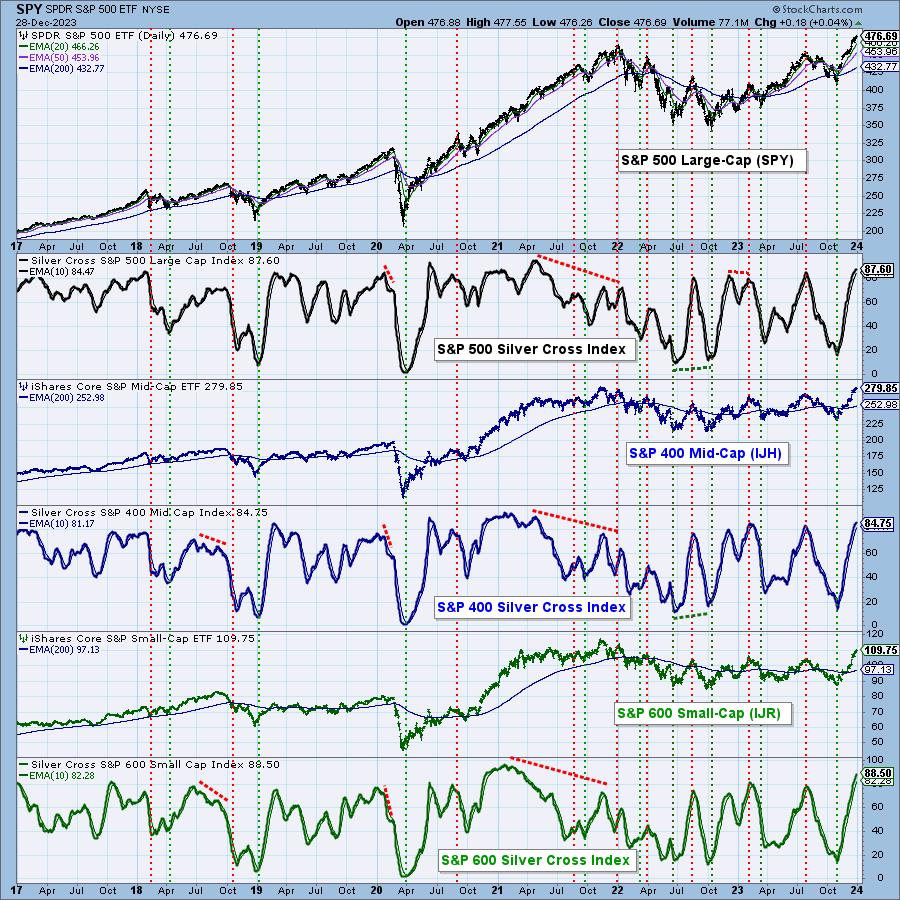
Being a long-term indicator, the slower, more deliberate pace of the GCI does not apply well to shorter time frames. To help with this we developed the Silver Cross Index (SCI), which is the percentage of stocks in a given index whose 20-day moving average has crossed up through their 50-day moving average (which we named the Silver Cross). The SCI shows the level of participation in the intermediate-term.
Here is a chart of the three S&P Indexes with their respective SCIs. We note that all the SCIs are in the mid to high eighties, which is near the top of their range, and is the overbought level for the last three years. As a general rule SCIs do not linger at these levels, and we should expect to see them turn down soon. We can observe that prices don’t always follow the SCIs down, but it is risky to assume otherwise.
Conclusion: Participation in the long term is weak, and it is overbought in the intermediate term. In our opinion the market is vulnerable for a correction.
Learn more about DecisionPoint.com:
Watch the latest episode of DecisionPoint on StockCharts TV’s YouTube channel here!

Try us out for two weeks with a trial subscription!
Use coupon code: DPTRIAL2 at checkout!
Technical Analysis is a windsock, not a crystal ball. –Carl Swenlin
(c) Copyright 2023 DecisionPoint.com
Disclaimer: This blog is for educational purposes only and should not be construed as financial advice. The ideas and strategies should never be used without first assessing your own personal and financial situation, or without consulting a financial professional. Any opinions expressed herein are solely those of the author, and do not in any way represent the views or opinions of any other person or entity.
DecisionPoint is not a registered investment advisor. Investment and trading decisions are solely your responsibility. DecisionPoint newsletters, blogs or website materials should NOT be interpreted as a recommendation or solicitation to buy or sell any security or to take any specific action.
Helpful DecisionPoint Links:
DecisionPoint Alert Chart List
DecisionPoint Golden Cross/Silver Cross Index Chart List
DecisionPoint Sector Chart List
Price Momentum Oscillator (PMO)
Swenlin Trading Oscillators (STO-B and STO-V)