The Home Construction ETF (ITB) led the market the first seven months of the year, but fell on hard times the last two months and reversed its long-term uptrend. Today’s report/video will look at the trend reversal in ITB using the RSI Trend Range indicator. We will then highlight a homebuilder with a confirmed Double Top and put forth a downside target. This bearish outlook jibes with our broad market analysis at Chart Trader.
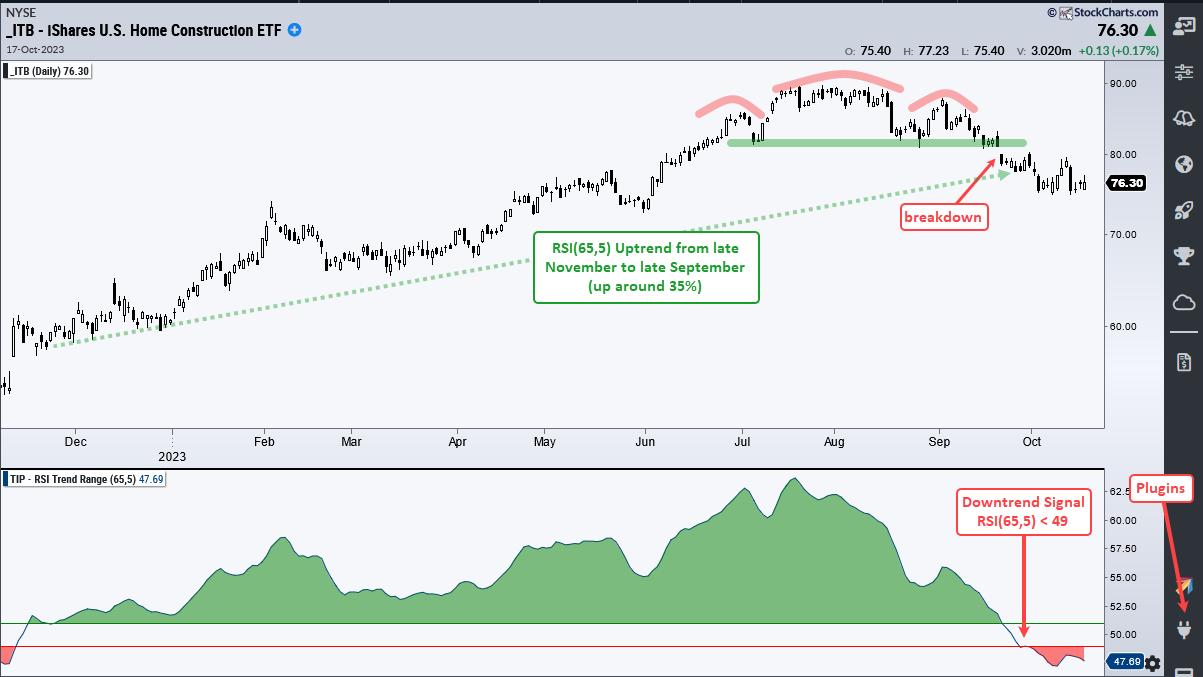
The first chart shows ITB with a head-and-shoulder top forming from late June to September. ITB broke support with a gap down on September 21st to confirm this pattern. The ETF continued lower into October and the big trend is down. Note that SPY is up around 2% in October, but ITB is down 2.79% and showing relative weakness.
RSI(65,5) confirms the trend change with a move below 49 on September 27th. This indicator is the 5-day SMA of 65-day RSI. Long-term momentum turns bullish (uptrend) with a move above 51 and stays bullish until a move below 49. The recent move below 49 confirms the trend reversal on the chart and I am bearish on ITB. This indicator is part of the TIP Indictor Edge Plugin for StockCharts ACP.
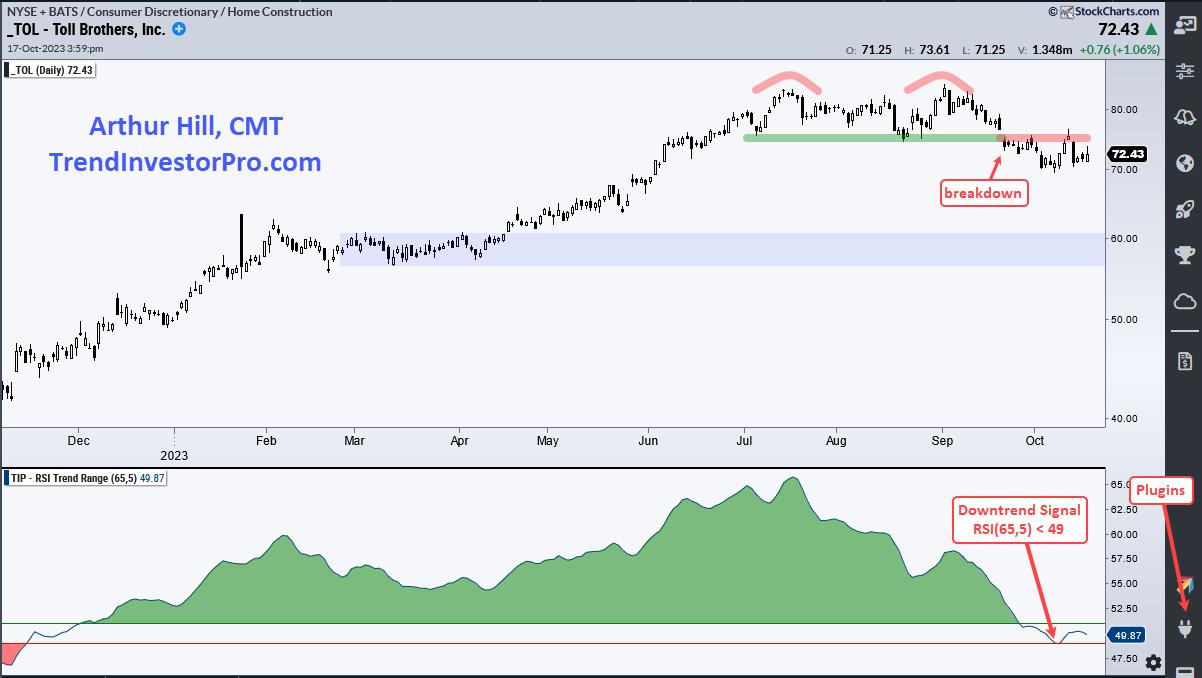
The next chart shows Toll Brothers (TOL) with a confirmed Double Top. The stock formed two highs in the 84 area (red arcs) and broke support at 75 on September 21st. TOL bounced in early October, but notice how broken support turned into first resistance (red line). The support break is holding and I view this as bearish. The blue shading marks the downside target in the 60 area. A close above 75 would warrant a re-evaluation.
This week at Chart Trader we focused on SPY and QQQ as they bounce within bigger downtrends. Both are near resistance/reversal zones and we marked the key levels to watch going forward. Chart Trader also features several trading ideas for ETFs and stocks. Each report includes a video. Click here to take a trial.
//////////////////////////////////////////////////