How many of you have heard me say that commodities are inherently volatile?
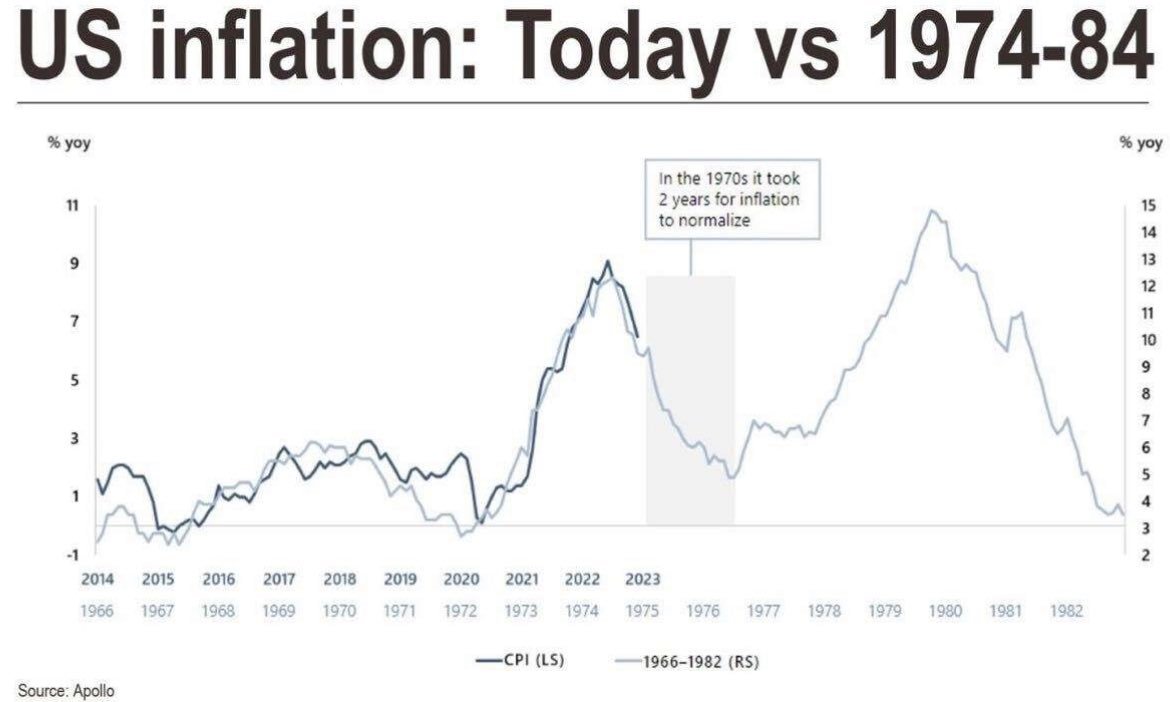
Clearly, from this chart, you can see that after the oil rally in the mid 1970s, the CPI went from nearly 9% in 1974 down to 2% in 1976. Sugar, my favorite barometer of inflation, ran to $.66 a pound in 1974, and then down to around $.08 cents a pound in 1976. Huge. As sugar peaked, inflation, as measured by CPI, had a stupendous drop within 2 years.
Similarly, the CPI peaked in June 2022 at around 9%, and here we are with CPI currently at 3.6%. If the timeline matches, we could see inflation decline further into 2024. However, everything moves a lot faster now.
So, let’s assume that history rhymes rather than repeats. If that is the case, inflation is due for another run, even if oil calms down from current levels.
After the trough in inflation in 1976, it took four years for the next peak to hit. In 1980, CPI reached nearly 15%. Sugar ran from $.08 back up to around $.45 a pound by 1980.
At present, if we reduce the timeframes, after 1.5 years of declining inflation, maybe we see another 2-3 years of climbing inflation.
Does inflation peak in 2024-2025? It may be a bit frightening, worrying about much higher inflation. Nonetheless, we look for opportunities to make money.
Last week we wrote about gold miners. Today, September 18th, GDX the ETF for gold miners cleared the 50-DMA for a second consecutive time and went into a confirmed recuperation phase. And that’s before the Fed meeting.
We also mentioned that miners often lead the precious metals markets. And all heading higher means more inflation concerns.
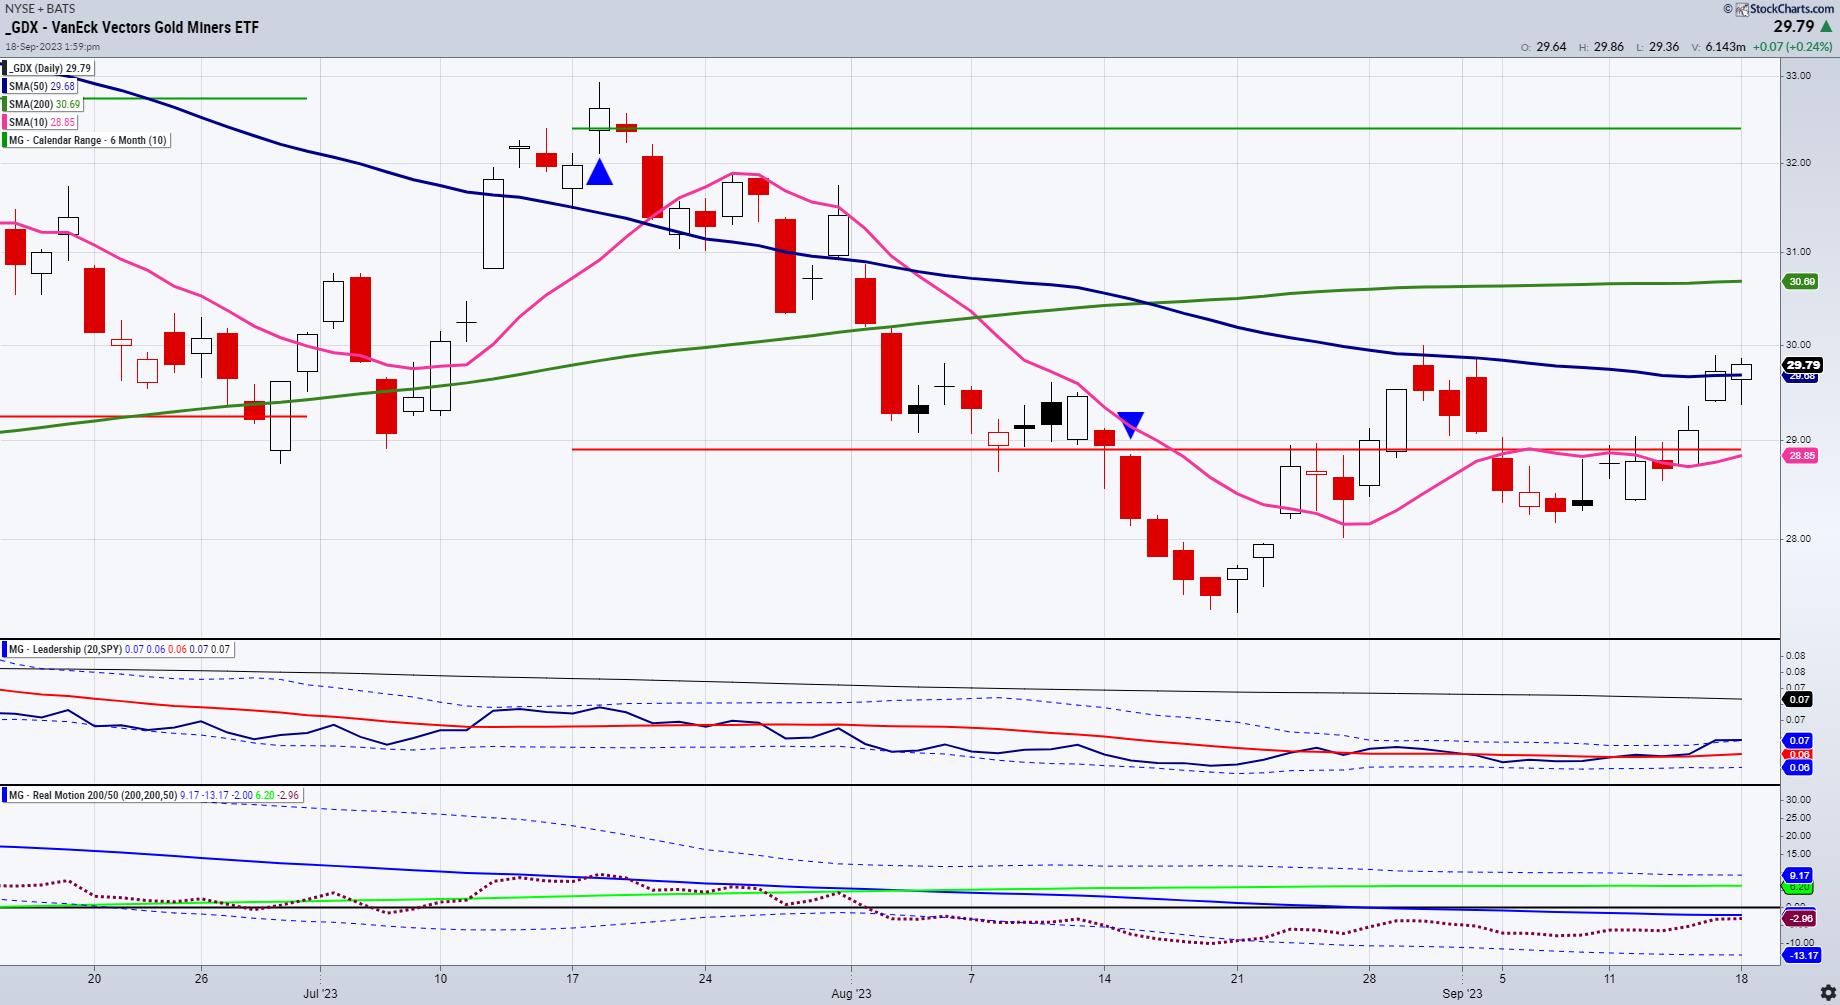
3 technical indicators to note, and all inline with the IBD interview featured over the weekend.
Calendar Ranges: GDX held the July 6-month calendar range low (red line). We consider that a reversal. There is still quite a distance to the July 6-month calendar range high (green line).
Phases: GDX has 2 closes over the 50-DMA, which has a slightly negative slope. However, the phase has improved to Recuperation. Additionally, Real Motion (momentum) shows some resistance at the 50-DMA (blue line). Hence, we need more momentum.
Leadership: GDX now convincingly outperforms the SPY. That too, however, needs a boost over the dotted Bollinger Band resistance.
Keep your eyes on the August 30th high at 30.00.
This is for educational purposes only. Trading comes with risk.
For more detailed trading information about our blended models, tools and trader education courses, contact Rob Quinn, our Chief Strategy Consultant, to learn more.
If you find it difficult to execute the MarketGauge strategies or would like to explore how we can do it for you, please email Ben Scheibe at Benny@MGAMLLC.com.

“I grew my money tree and so can you!” – Mish Schneider
Get your copy of Plant Your Money Tree: A Guide to Growing Your Wealth and a special bonus here.
Follow Mish on Twitter @marketminute for stock picks and more. Follow Mish on Instagram (mishschneider) for daily morning videos. To see updated media clips, click here.
In this appearance on Business First AM, Mish explains why she’s recommending TEVA, an Israeli pharmaceutical company outperforming the market-action plan.
As the stock market tries to shake off a slow summer, Mish joins Investing with IBD to explain how she avoids analysis paralysis using the six market phases and the economic modern family. This edition of the podcast takes a look at the warnings, the pockets of strength, and how to see the bigger picture.
Mish was the special guest in this edition of Traders Edge, hosted by Jim Iuorio and Bobby Iaccino!
In this Q3 edition of StockCharts TV’s Charting Forward 2023, Mish joins a panel run by David Keller and featuring Julius de Kempenaer (RRG Research & StockCharts.com) and Tom Bowley (EarningsBeats). In this unstructured conversation, the group shares notes and charts to highlight what they see as important considerations in today’s market environment.
Mish discusses AAPL in the wake of the iPhone 15 announcement on Business First AM.
Mish explains how to follow the numbers in oil, gas, gold, indices, and the dollar daytrading the CPI in this video from CMC Markets.
Mish talks commodities, and how growth could fall while raw materials could run after CPI, in this appearance on BNN Bloomberg.
In this appearance on Fox Business’ Making Money with Charles Payne, Mish and Charles discuss the normalization of rates and the benefit, plus stocks/ETFs to buy.
Mish chats about sugar, geopolitics, social unrest and inflation in this video from CNBC Asia.
Mish talks inflation that could lead to recession on Singapore Breakfast Radio.
Coming Up:
September 19: Jared Blikre, Yahoo Finance
September 20: Your Daily Five, StockCharts TV
September 22: Benzinga Prep Show
October 29-31: The Money Show
- S&P 500 (SPY): 440 support, 458 resistance.
- Russell 2000 (IWM): 185 pivotal, 180 support.
- Dow (DIA): 347 pivotal.
- Nasdaq (QQQ): 363 support, over 375 looks better.
- Regional Banks (KRE): 44 pivotal.
- Semiconductors (SMH): 150 pivotal.
- Transportation (IYT): Needs to get back over 247 to look healthier.
- Biotechnology (IBB): Compression between 124-130.
- Retail (XRT): Weak, but noisy unless this breaks down under 57, the 80-month moving average.
Mish Schneider
MarketGauge.com
Director of Trading Research and Education