
During the pandemic, homes were buzzing with activity. Video calls, online convos, signing documents electronically… the list goes on. Now that things have normalized, some of those activities aren’t as central to our lives as they used to be, and thus many of the “pandemic” stocks lost value. But now, some of those stocks look like they may be recovering.
Earlier this week, one of the stocks that popped up in the SCTR Scan was Docusign (DOCU). The company grew during the pandemic, but post-pandemic is a different story. DOCU has faced many headwinds—layoffs, CEO change, falling stock price. But it looks like things may have stabilized. Does that mean the stock of the electronic signature software company may be turning around?
A Weekly Point of View
It’s worth looking at the weekly chart of DOCU.
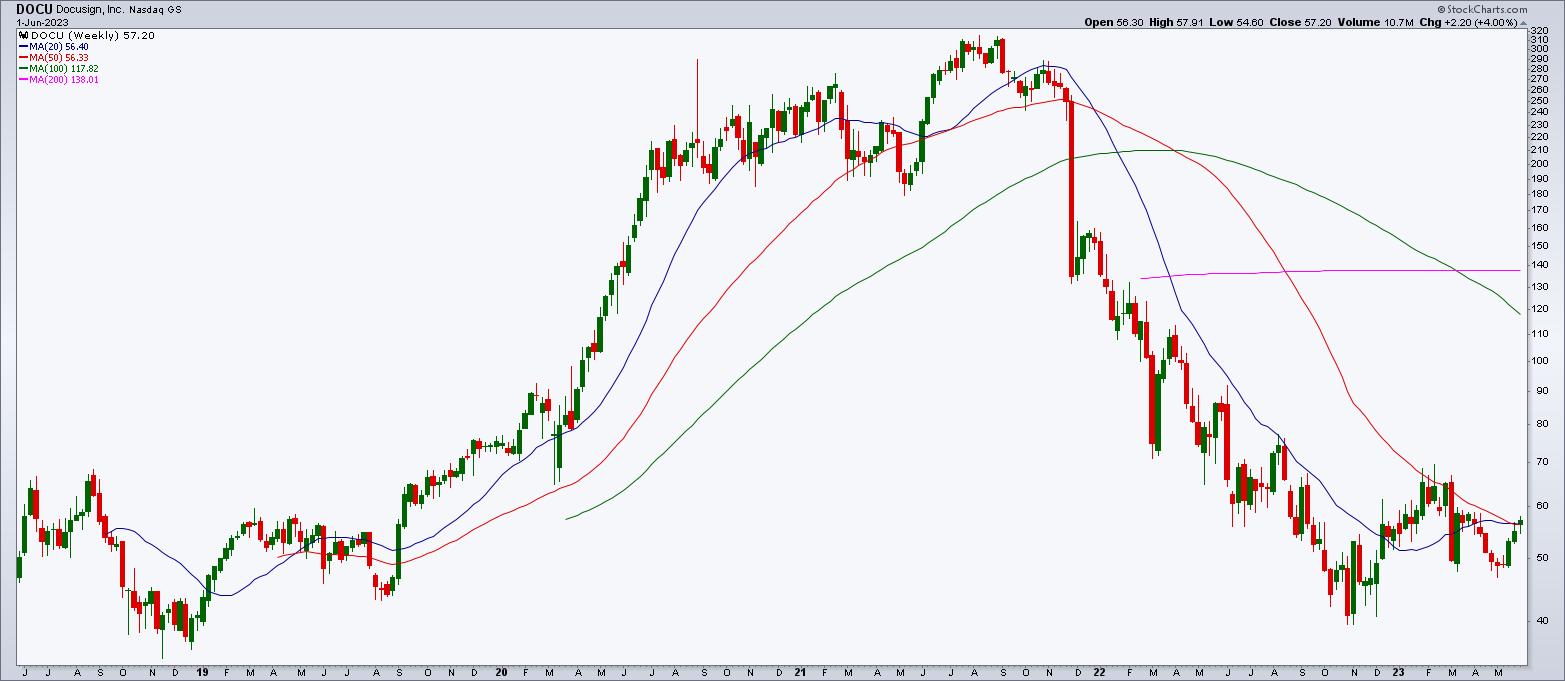
CHART 1: WEEKLY CHART OF DOCU STOCK. After going through a significant selloff, the stock is showing signs of stability.Chart source: StockCharts.com (click chart for live version). For illustrative purposes only.
Docusign stock price rose during the pandemic, reaching a high of $314.70 in August 2021. Since then, the stock price has cascaded lower, hitting a low of $39.57 in November 2022. That’s quite a drop.
Zeroing In: Daily Price Action in DOCU Stock
The big question is, “Is the stock ripe for a reversal?” Let’s switch to a daily chart.
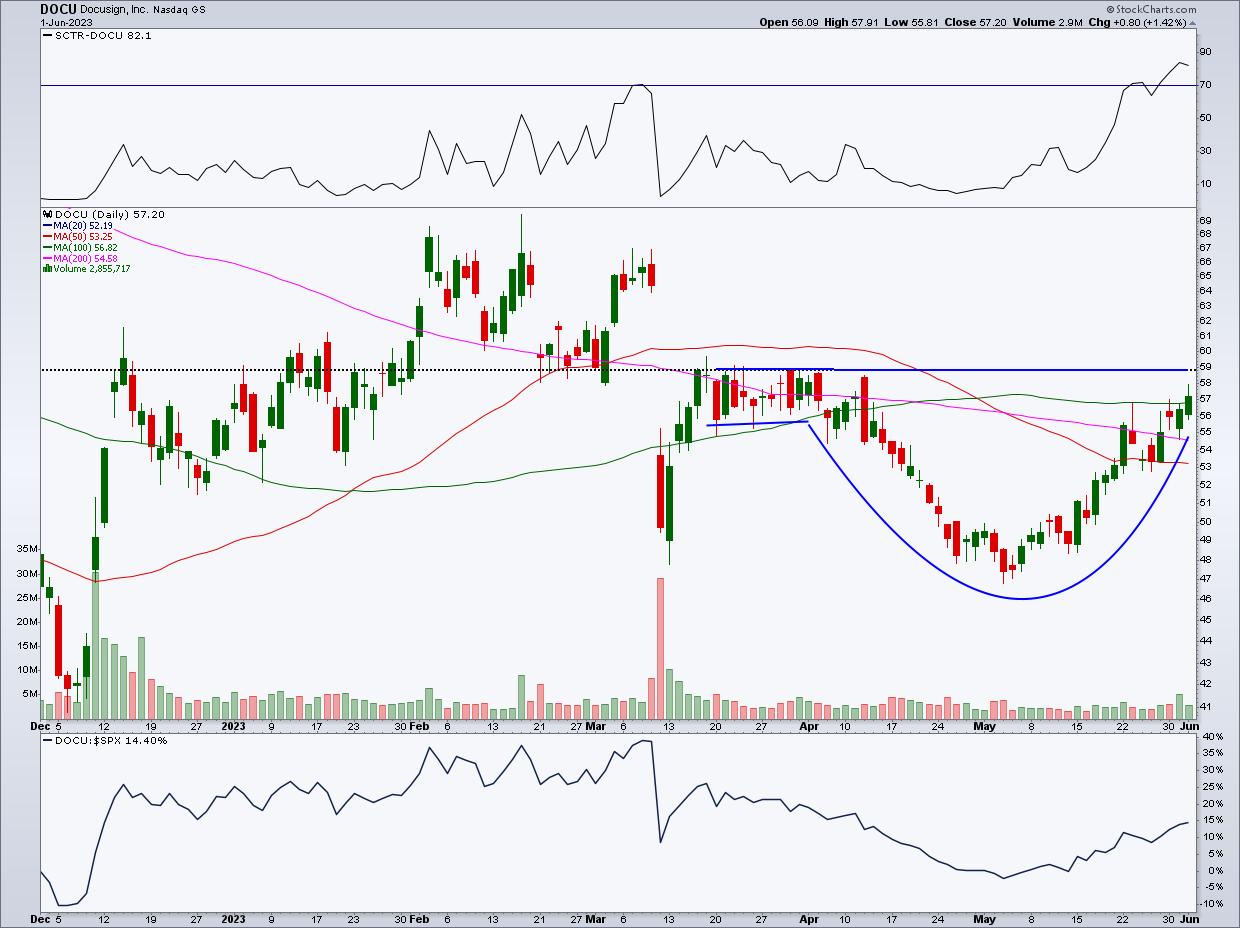
CHART 2: DAILY CHART OF DOCU STOCK. There’s a chance the stock could break out above $58.80, but it may go through a short consolidation period before a confirmed breakout.Chart source: StockCharts.com (click chart for live version). For illustrative purposes only.
Since November, DOCU has gone through a volatile ride, gapping up, gapping down, and having some pretty wide up-and-down range days. From early May, the stock has moved higher, with a consistent pattern of higher highs and higher lows. The stock is now trading above its 100-day moving average and is approaching a critical resistance level of $58.80, which was a resistance level in March after a huge gap down in the stock price.
There are a couple of points to note. The SCTR score for DOCU has crossed above 70, whereas in the short-lived March rally, the SCTR didn’t even reach 50. Relative strength with respect to the S&P 500 index ($SPX) is trending higher, albeit gradually. It all depends on what happens when the stock hits its next resistance level. If the stock price breaks through the resistance level with follow-through, it could be a great entry point. If that happens, the SCTR is likely to remain above 70 and the stock could show continued relative strength against the S&P 500 index.
The downside: The moving averages are not trending up, so there’s a chance the stock could stall and go through a consolidation pattern, similar to what it did in March. After the consolidation, the price could go either way. If it goes lower, it would be a repeat of the previous down move. If the price moves higher, there’s a chance we could see a Cup with Handle pattern (although the front spout would make it look more like a teapot), which would mean a short-term consolidation phase before a breakout.
How to Trade DOCU Stock
- Going back to the daily chart, if the stock price breaks above $58.80, a short-term price target would be around $67, which is where price was before the March gap down.
- For a longer-term trade, the price target would be much higher. You would stay in the trade as long as the pattern of higher highs and higher lows continues. If there’s a change in that pattern, you’re better off exiting the trade.
- As long as the SCTR remains above 70 and relative strength against the S&P 500 index continues trending higher, your long position can remain in play. But if technical conditions weaken for DOCU, you’re better off exiting your trade.
Other Stocks From the Scan
Here are some other stocks that showed up on the large-cap SCTR scan.
Baidu, Inc. (BIDU)
Booking Holdings Inc. (BKNG)
Cardinal Health (CAH)
Formula One Group (FWONK)
Sony Group Corporation (SONY)
Looking Back at HSY
On May 24, Hershey Foods Corp (HSY) was the featured SCTR scan stock. Let’s look at how that stock is performing.
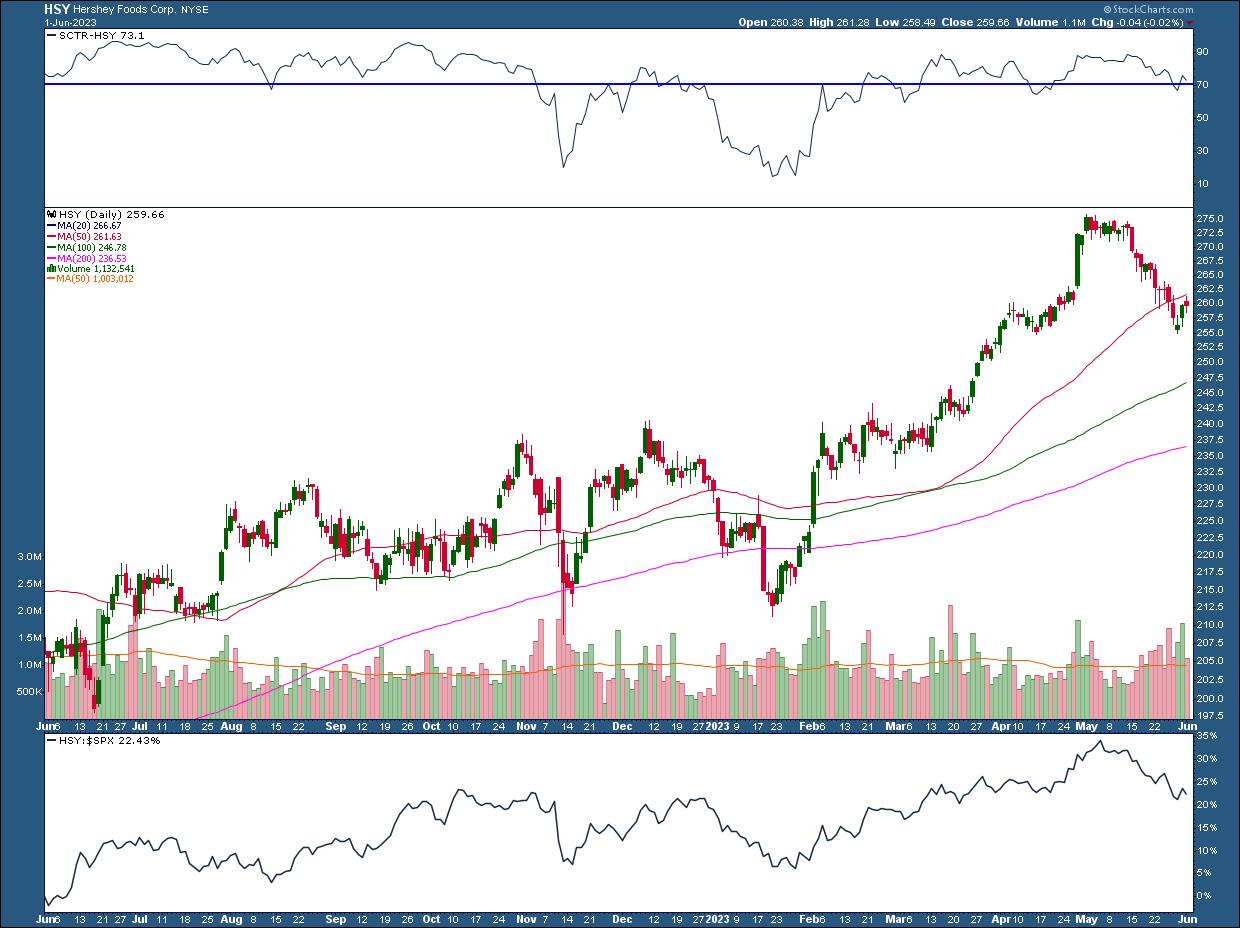
CHART 3: HERSHEY STOCK TRADING BELOW 50-DAY MOVING AVERAGE. The moving average, previously a support level, is now a resistance level. If the stock doesn’t break above the moving average, the SCTR isn’t able to stay above 70, and relative strength against the S&P 500 index continues to weaken, you may want to revisit this stock at a later time.Chart source: StockCharts.com (click chart for live version). For illustrative purposes only.
Hershey’s stock fell below its 50-day moving average, which is now looking like it may be a resistance level. The SCTR score is flirting with the 70 level, and relative strength against the S&P 500 index is trending lower. So this stock may be one to revisit at a later time.
SCTR Crossing Scan
[country is US]
AND [sma(20,volume) > 100000]
AND [[SCTR.large x 76] or [SCTR.large x 78] or [SCTR.large x80]]
Credit goes to Greg Schnell, CMT, MFTA.

Disclaimer: This blog is for educational purposes only and should not be construed as financial advice. The ideas and strategies should never be used without first assessing your own personal and financial situation, or without consulting a financial professional.