StockCharts users can chart the Zweig Breadth Thrust for the S&P 1500 or any other index that has Advance-Decline Percent data. All we have to do its convert the Zweig Breadth Thrust levels to their equivalents using Advance-Decline Percent.
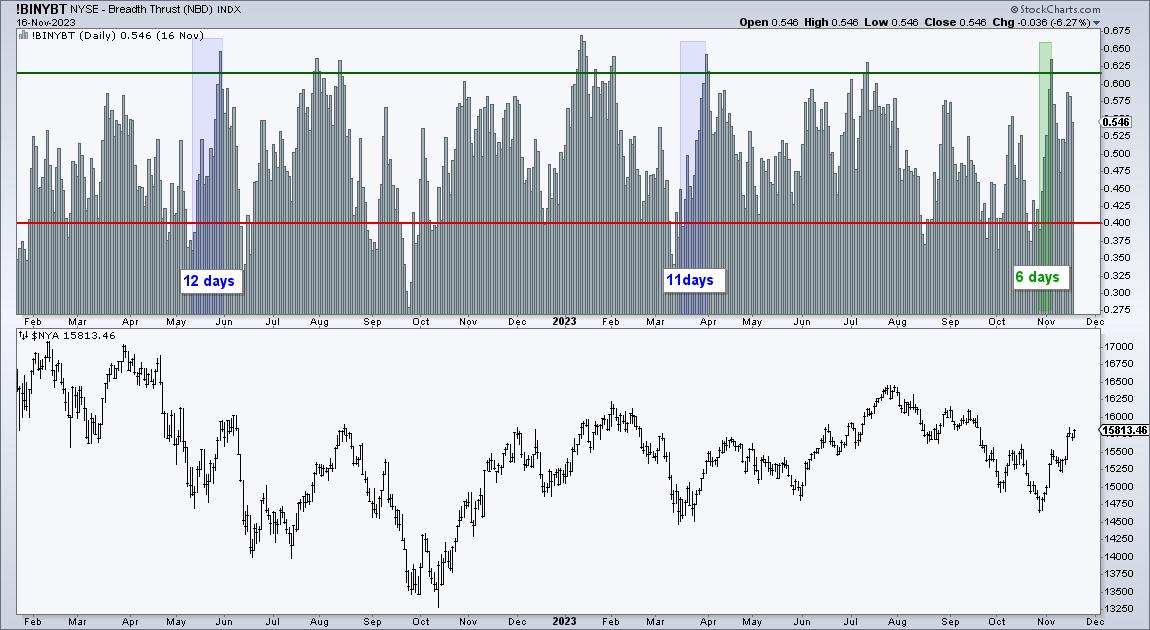
The Zweig Breadth Thrust is based on percent advances for the NYSE. It is Advances / (Advances + Declines). If there are 800 advances and 1200 declines, then this indicator would be .40 (800/(800+1200)). If there were 1230 advances and 770 declines, then this indicator would be .615 (1230/(1230+770)).
The chart above shows the key levels for the Zweig Breadth Thrust. The indicator triggers bullish when it moves from below .40 to above .615 within 10 days.
Now we can convert these levels into Advance-Decline Percent levels. Advance-Decline Percent is the percentage of advancing stocks less the percentage of declining stocks. There are 1500 stocks in this example. 600 advances would be 40% of 1500 and 900 declines would be 60%. 40% Advances less 60% declines would be -20% for Advance-Decline Percent. Thus, AD% must dip below -20% for a potential Zweig Breadth Thrust.
If there are 923 advances (61.5%) and 770 declines (38.5%), then Advance-Decline Percent would be +23% (61.5% less 38.5%). Thus, AD% must move from below 20% to above 23% within 10 days to trigger a Zweig Breadth Thrust.
Chartists interested in charting the Zweig Breadth Thrust can do so for the following indexes with Advance-Decline Percent.
- S&P 500 AD% ($SPXADP)
- Nasdaq 100 AD% ($NDXADP)
- S&P MidCap 400 AD% ($MIDADP)
- S&P SmallCap 600 AD% ($SMLADP)
- S&P 1500 AD% ($SUPADP)
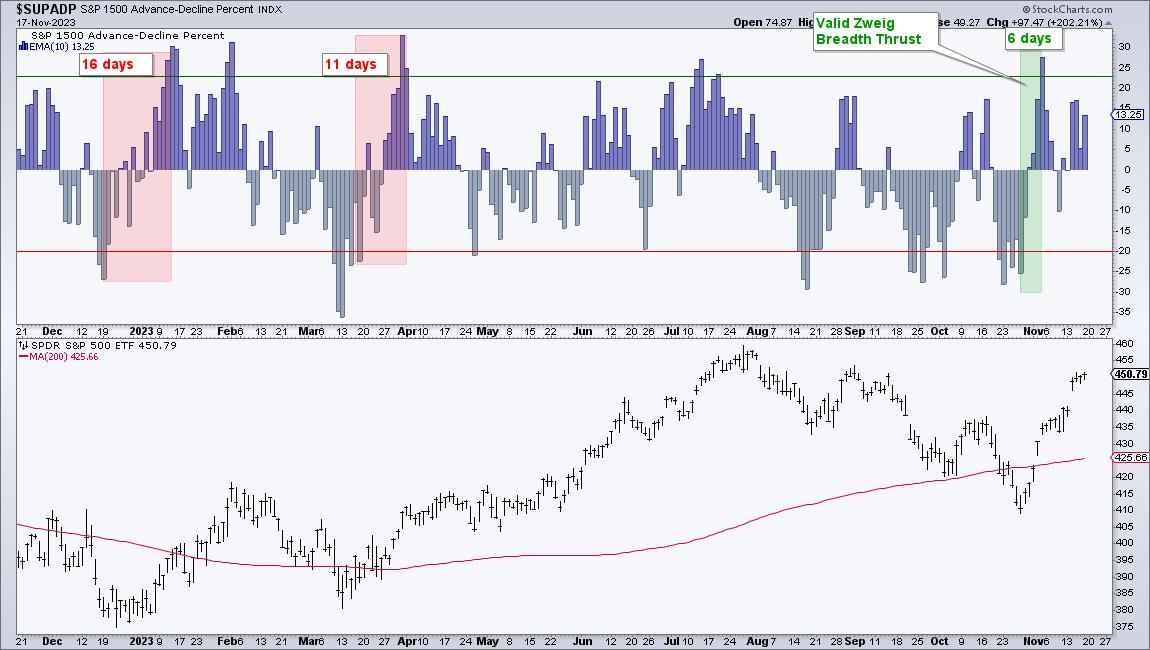
The chart below shows the Zweig Breadth Thrust using S&P 1500 AD$ ($SUPADP). Personally, I would stick with the S&P 1500 because it is the broadest of the five indexes. Zweig used NYSE breadth data in the 80s because it was the “Big Board”. NYSE breadth captured a broad swath of the stock market. Today is different because the Nasdaq is now the place to be.
TrendInvestorPro tested S&P 1500 Zweig Breadth Thrust signals on the S&P 500 SPDR (SPY). This indicator is designed to identify sudden and sharp reversals that can foreshadow extended moves. It is not used for timing exits so we used a trend-following indicator to time the exit. Results are promising with a 67% win rate and a much lower drawdown than buy-and-hold.
We are not publishing Chart Trader reports and videos during Thanksgiving week (20-24 November). However, there is still plenty to learn from our education reports and trading strategies. Subscribers get immediate access to:
- The Essential Breadth Indicator ChartList (with report and video)
- Building a Strategy around the Zweig Breadth Thrust
- Momentum Rotation Strategy for NDX and SPX Stocks
- Mean-Reversion Strategy for Russell 1000 Stocks
Special Action for StockCharts Extra and Pro Members
Get the edge with inside information, information inside the indexes and sectors, that is. TrendInvestorPro put together a comprehensive chart list focusing on breadth indicators. There are over 100 customized charts covering over 50 breadth indicators organized in a logical manner. A full report and comprehensive video accompany this list. Note that you must be an Extra or Pro subscriber to have more than one ChartList at StockCharts.
Click here to sign up for TrendInvestorPro and get this invaluable ChartList!
//////////////////////////////////////////////////