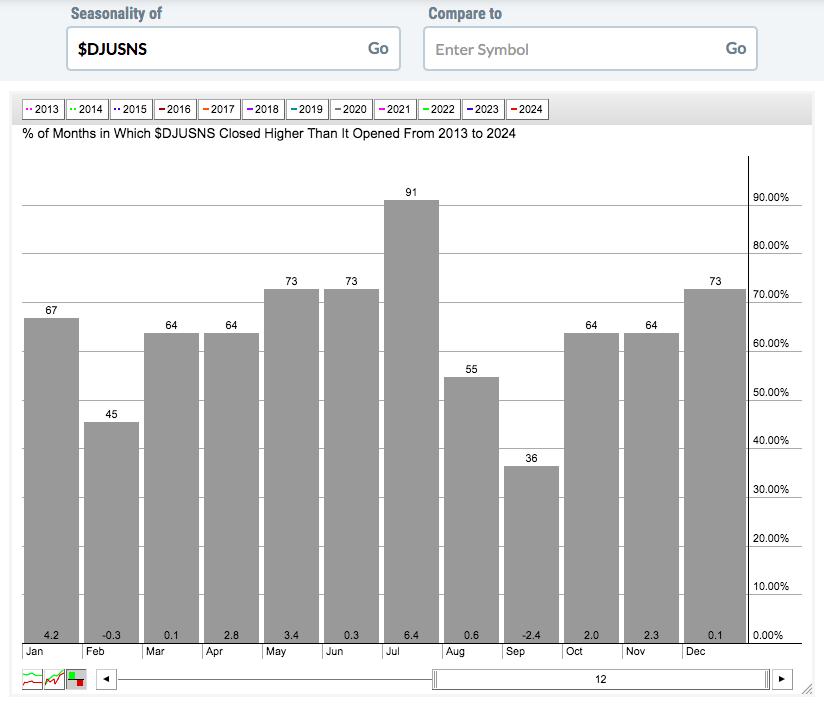
Important days for stocks usually are associated with big volume, major support/resistance, and a test of leadership. As I look at Upwork, Inc. (UPWK), it’s check, check, and check. Before I look at UPWK individually, let me show you what we typically see with internet stocks (which UPWK is a part of) during the month of January:
Throughout this secular bull market (since 2013), the DJUSNS has produced January gains two-thirds of the time. The average January performance over this period is 4.2%, which only trails the month of July. The bottom line is that internet stocks love the month of January. Outside of the opening day of 2024, stocks like META, NFLX, and PINS have already started the year off quite strong. This only adds to the odds of a UPWK rally if we see a clear breakout later today. And if we fail today, I wouldn’t write UPWK off. Rather, it’s likely to just be a delay before stronger price action arrives.
Let’s look at the UPWK chart:
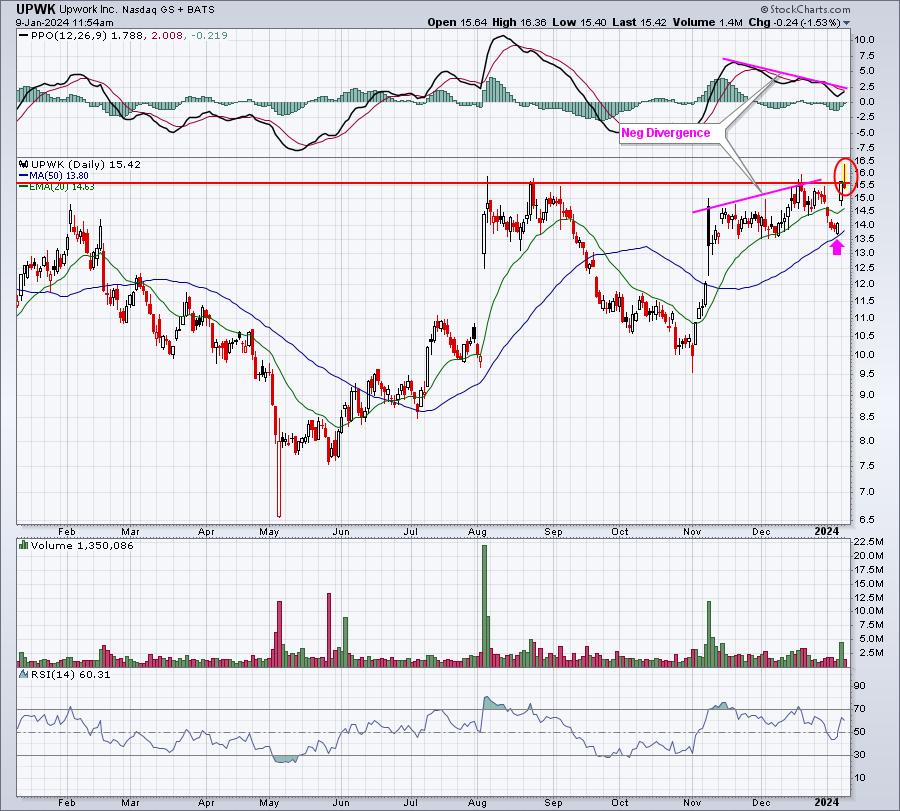
Yesterday, UPWK closed at 15.66, which eclipsed the prior high candle body of 15.57. That slight breakout was also accompanied by the heaviest daily volume in two months. In my opinion, today is the day for UPWK. We gapped slightly lower at the opening bell to 15.64, but surged in very early action to 16.36, UPWK’s highest level since reaching 16.39 on September 16, 2022. Volume has very heavy out of the gate this morning. But UPWK has since reversed, losing over a buck from Monday’s high. So the question today is, “Does UPWK strengthen this afternoon to add a second straight 16-month high close or does a shooting star candle (or bearish engulfing candle) and false breakout print?” The answer to that question will likely determine UPWK’s short-term price direction. I love the clear-cut bottoming process in play here, as evidenced by reverse head & shoulders pattern, but ultimately, UPWK needs to break that neckline resistance with some momentum. Check out this potential H&S bottoming pattern:
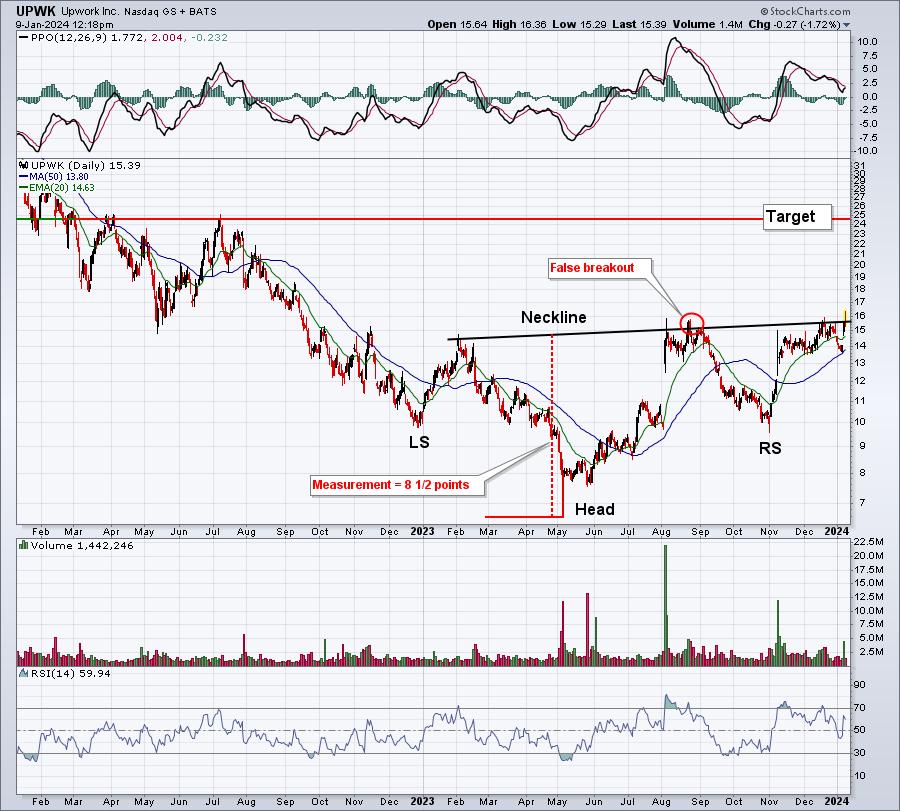
This could turn into a big bullish afternoon reversal and breakout OR a miserable failed breakout. But it’s these types of days that I like to pay close attention to as a trader.
Finally, S&P 500 performance during the month of January has a long history of providing us excellent clues as to where the U.S. stock market is heading later in the year. If you’d like to see the impact that a strong January has on the balance of the year, and you’re not already an EB Digest subscriber, simply CLICK HERE to provide your name and email address. The EB Digest is totally FREE, no credit card information is required, and you may unsubscribe at any time.
Happy trading!
Tom