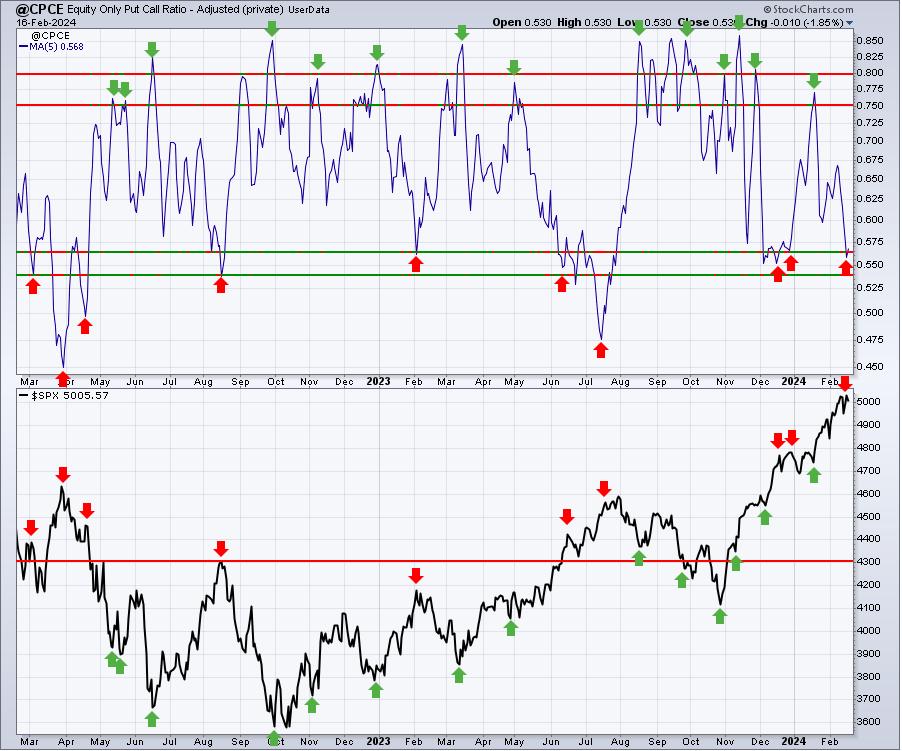
While many analysts follow sentiment signals that involve feelings about market direction, I prefer one that follows the MONEY. I want to know what retail traders are doing with their money with respect to options. Extreme readings provide eerily accurate reversals in trend, which are obviously very important to any trader. I like to call the 5-day SMA of the equity-only put-call ratio ($CPCE) my “speed boat” sentiment indicator as it’s excellent at predicting SHORT-TERM reversals. I track the CPCE using the User-Defined Index (UDI) tool here at StockCharts.com. Over the past two years, there have been occasions (mostly during Q4 on Wednesdays) when hedge funds have bought a MASSIVE number of equity puts on many of the largest cap companies in the world, like Apple (AAPL), Microsoft (MSFT), Amazon.com (AMZN), Alphabet (GOOGL), NVIDIA (NVDA), Meta Platforms (META), Tesla (TSLA), etc. These equity puts need to be adjusted OUT of the ratio, because they do not reflect on the retail option trader. Here’s my adjusted 5-day SMA of the CPCE over the past couple years:
The CPCE measures the amount of bullishness (low CPCE readings) and bearishness (high CPCE readings) in the options world. Extended periods of bullishness and bearishness are marked in the chart with red arrows and green arrows, respectively, as the 5-day moving average of the CPCE moves toward one extreme or the other. Any time that we see the 5-day CPCE reach the .55-.57 range to the downside (or lower), we can look for a possible short-term market top. Note that subsequent market declines may be quite brief, and sometimes very mild. The takeaway here is to realize that low readings, like the one we have right now, provide us a warning that the RISK of a market decline has increased substantially. Managing risk is a top priority for successful traders.
This low potentially-bearish reading on the CPCE will very likely impact the timing of our entry into 10 equal-weighted stocks in each of our portfolios at EarningsBeats.com. We just completed the end of our latest quarter, where our flagship Model Portfolio gained 21.87%, easily outperforming the S&P 500’s gain of 10.08% over the same period. Since the inception of our Model Portfolio in 2018, its performance has more than doubled the S&P 500 as well, 182.59% vs. 86.03%. We’ll be “drafting” our Top 10 Stock Picks for our Model Portfolio, as well as our Aggressive and Income Portfolios, on Tuesday, February 20th, at 5:30pm ET. For more information and to register for this FREE event, simply CLICK HERE.
Happy trading!
Tom