

Put buyers are growing bolder around the NDX
Subscribers to Chart of the Week received this commentary on Sunday, October 2.
Wall Street is crawling to the finish line of what’s turned out to be a very painful monthly and quarterly stretch for markets, and this week in particular put an extra dash of salt in the proverbial wound. There was quite a bit of last-minute selling during several of this week’s sessions, sending the major indexes spiraling back toward their 2020 pandemic-era levels.
It’s no secret that the tech sector has been getting hit especially hard while Fed fears and surging bond yields inhibit growth stocks. The tech-heavy Nasdaq-100 Index (NDX) briefly tumbled back below the round 11,100 level on Thursday and is eyeing its third consecutive weekly drop – as well as substantial losses for the month and quarter.
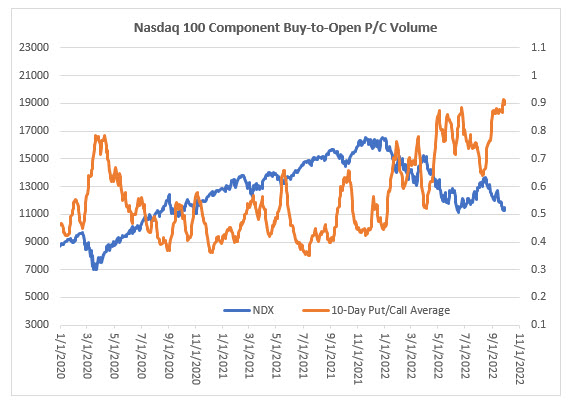
During all of this carnage, the NDX’s component buy-to-open 10-day put/call volume ratio closed at 0.90 on that Thursday, and just a few days earlier on Monday, September 26, the reading hit 0.916, a record high. This means options players have been having a field day with puts, which outnumbered calls on Monday at their quickest pace ever.
A look at the chart below shows this ratio running up to the 0.9 level several times in the past couple months, then a brief consolidation period before breaking higher. Also note that the NDX’s 10-day put/call ratio never topped 0.8 back in 2020 when the pandemic and subsequent lockdown sparked a round of panicked selling in March of that year.
Does this mean you should join these bears and start placing bets on more downside for the tech sector? It’s no secret that the market has been messy lately, but we’ve broken down some particularly poor performers to keep an eye on in the coming month. Schaeffer’s Senior Quantitative Analyst Rocky White shared a list of stocks with the worst monthly returns in October, going back 10 years. Three household tech names popped up on the list, Cisco Systems (CSCO), Advanced Micro Devices (AMD), and Western Digital Corp (WDC).
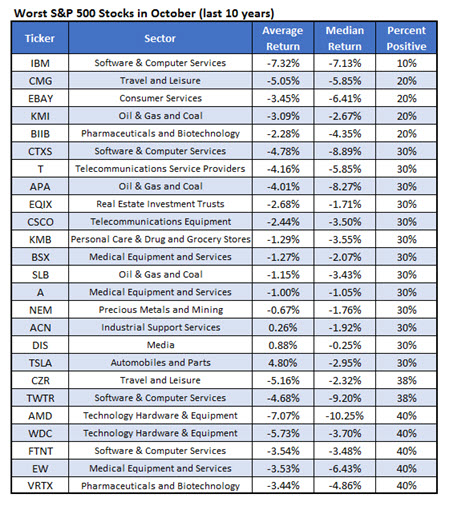
Chip stock Advanced Micro Devices only saw negative one-month returns 60% of the time, but its average drop is alarming at 10.3%, easily the worst performer on the list. The equity has already lost 55% this year, and hit a two-year low of $62.83 on Thursday, but a similar move from where it currently sits just above here would put AMD at $56, a level not seen since July 2020.
Despite everything, analysts have remained puzzlingly optimistic, which could open the door for bear notes, especially as the company prepares for its upcoming earnings on Oct. 24. Of the 26 analysts in coverage, 19 consider AMD a “buy” or better, while just seven say “hold,” with nary a sell to be seen. What’s more, the 12-month consensus price target of $121.72 stands at a more than 87% premium to the equity’s Friday perch.
While the average monthly losses Western Digital and Cisco Systems sustained haven’t been nearly as brutal, the latter has only managed to lock in a positive return for October three times in the past 10 years, averaging a 2.4% drop. Meanwhile, WDC has taken a haircut during seven of the past 10 October, averaging a -5.7% return. Both of these stocks are hovering just above their recently logged multi-year lows, but a similar drop from either name would mean a new a new annual bottom on the charts.
So is it worth it to join in with these put traders or wait out the tech sector’s decline on the sidelines. That’s a question for each individual trader to decide. It might be worth noting that AMD and CSCO have tended to outperform options’ players volatility expectations over the past year, per their Schaeffer’s Volatility Scorecards (SVS) of 92 and 87, respectively. In other words, these stocks look like optimal candidates for premium buyers. No matter which path you choose to take, the unusual options activity surrounding the NDX is definitely worth keeping an eye on as we head into a new month and quarter.
Image and article originally from www.schaeffersresearch.com. Read the original article here.