
The S&P 500 is battling the 200-day SMA with four crosses over the last eleven days. We are also seeing a rise in volatility as this market benchmark plunged 5.86% in nine days (18-27 October) and then surged 5.85% the last five days. With such conditions, it is a good time to step back and look for ways to filter the noise. Today’s report will show a technique and quantify the signals with a back test. Read to the end for an offer to access the extended version of this report.
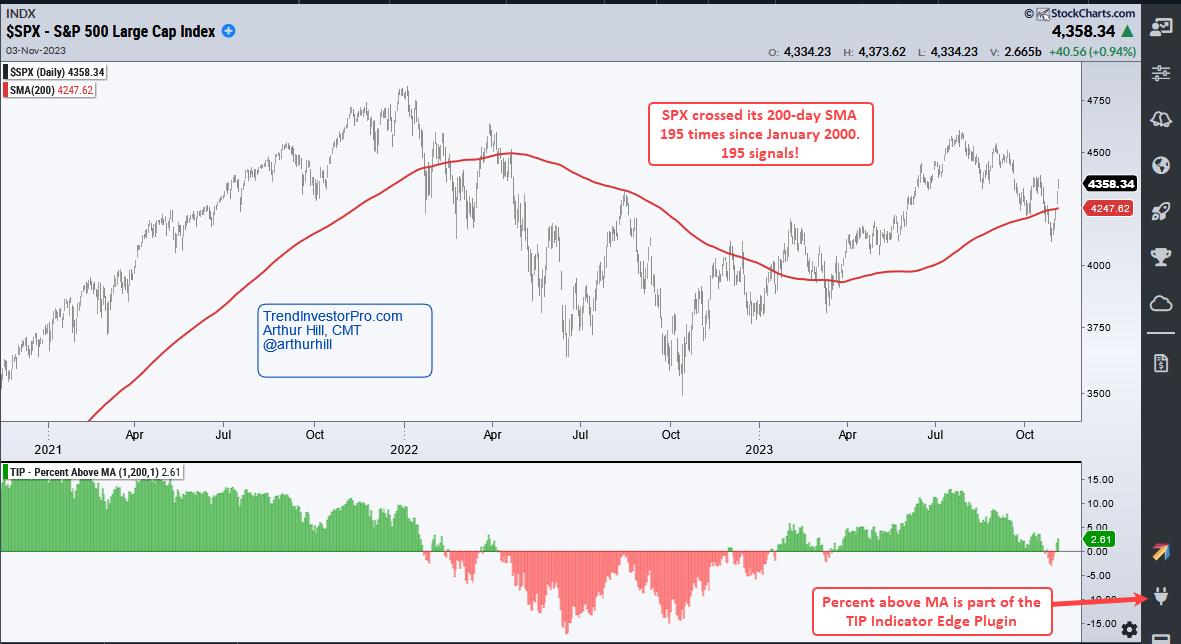
The chart below shows the S&P 500 with the 200-day SMA (red line) and the Percent above MA (1,200) indicator. This indicator shows the percentage difference between the close and the 200-day. It turns green when SPX crosses above the 200-day SMA and red when it crosses below. SPX crossed its 200-day SMA 195 times since January 2000. Anyone trading such a signal would experience lots of whipsaws and relatively small returns.
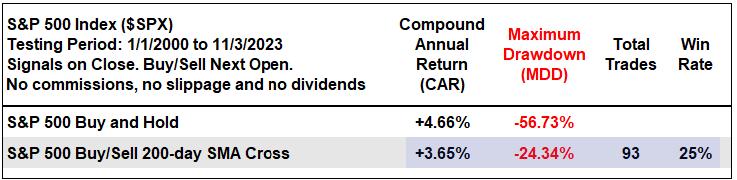
As the table below shows, there were 93 trades since January 2000. This means there were over 180 crosses of the 200-day moving average. Buy-and-hold for the S&P 500 generated a 4.66% Compound Annual Return with a 56.73% Maximum Drawdown. In contrast, trading the 200-day cross returned 3.65% with a Maximum Drawdown of 21.31%. This moving average cross strategy reduced the drawdown, but the whipsaws ate into the returns.
Chartists can improve performance by adding a filter. The next image shows the Percent above MA indicator with a 3% filter. This means the S&P 500 must be at least 3% above its 200-day SMA to generate a buy signal and 3% below its 200-day SMA for a sell signal. This strategy turned bullish on January 31st and remains bullish. The 5-day SMA was 2.9% below the 200-day SMA on October 27th and did not trigger a sell signal. According to this measure, the S&P 500 is still in a long-term uptrend.
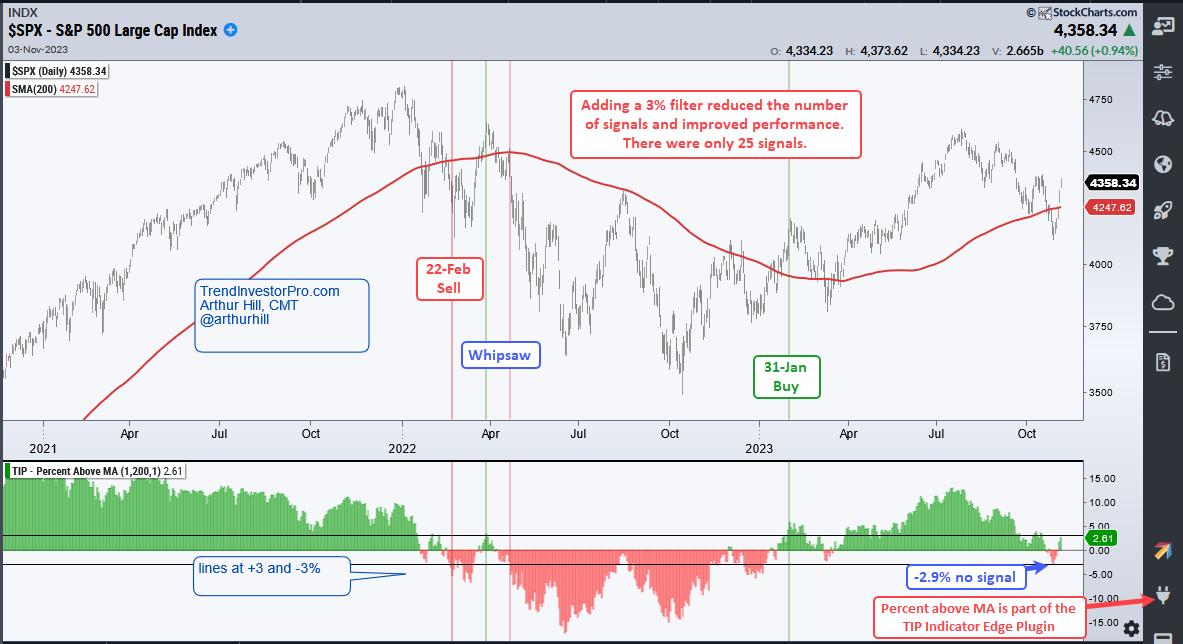
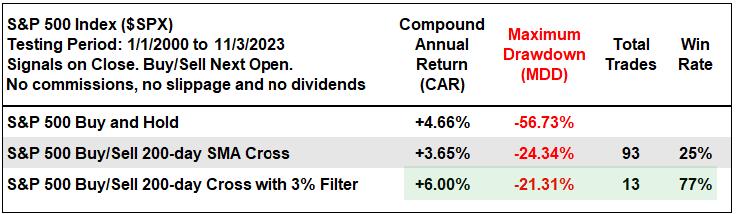
This simple filter seriously reduced the number of whipsaws because there were only 13 trades. The table below also shows a much improved performance. Compound Annual Return improved to 6% and the Maximum Drawdown dropped to 21.31%. The Win Rate more than tripled with an increase from 25% to 77%.
The S&P 500 is the most widely followed benchmark for US stocks and the 200-day SMA is the most popular long-term moving average. Perhaps the 200-day SMA works well for the S&P 500 because some many traders, investors and institutions watch it. While it may be a self-fulfilling prophecy, it is important to know the status of the S&P 500 because this is the single most important barometer for US stocks. In general, positive outcomes are more likely when the S&P 500 is above its 200-day SMA and negative outcomes are more likely when the index is below its 200-day.
Can we improve performance even more? How do the Nasdaq 100, S&P MidCap 400 and Russell 2000 perform with long-term timing? This report continues for subscribers to TrendInvestorPro. Look for the update on Sunday. We will take smoothing one step further and then test the results for the major stock indexes. This report includes expanded performance metrics and chart signal examples. Click here for more information.
///////////////////////////////////////
Image and article originally from stockcharts.com. Read the original article here.