Rate hikes and the Federal Reserve remained in focus as we headed into the holiday season
Subscribers to Chart of the Week received this commentary on Sunday, December 18.
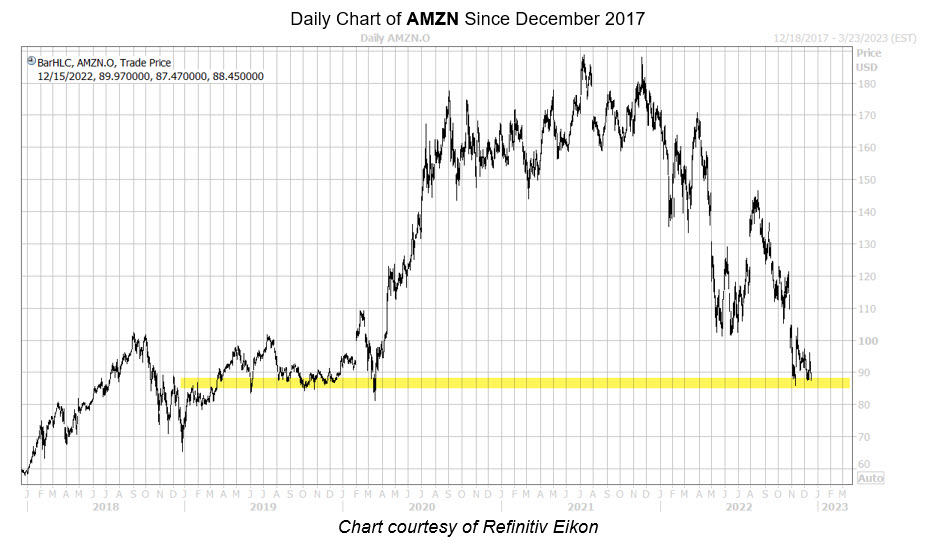
Rate hikes and the Federal Reserve have remained in focus as we head into the holiday season, especially as Big Tech firms shift into large layoffs to deal with rising costs. One of the bigger names that brought attention to the layoff trend is e-tailer Amazon.com, Inc. (NASDAQ:AMZN). Following a long downtrend, Amazon.com stock has recently found stable support near its 2019 lows in the high $80 range. The security is also holding the -50% year-to-date level, which presents a discount opportunity for AMZN buyers, especially as the company stands as a top member of the cloud services industry.
Inflation has hit Jeff Bezos’ mega-cap name especially hard due to FX headwinds, with the U.S. dollar rising as the company’s European revenues fell. In addition, the expansion of operating expenses has weighed on Amazon.com shares. In simpler terms, any incoming inflation relief in the near future could boost profits substantially.
The company is also slashing capital expenditures (CapEX) to increase the free cash flow (CF) and enhance profitability in the second half of 2022. This may continue into 2023, and given a higher CF/CapEX ratio, could fund the acquisition of new, longer-term assets. In fact, the stock’s price/sales ratio is declining, and nearing 1.66. When the ratio sat near this level in the past, which was from 2014 to 2015, it laid out a tremendous buying opportunity in the long-term.
Even further, despite a looming recession, the company said it’s expecting a +10% revenue increase in 2022. A broader look shows the tech giant’s Amazon Web Services (AWS) model is expected to grow 27% year-over-year, over the next five years. It also does not come as a surprise that the security is a market leader in e-commerce and cloud infrastructure (as mentioned above), by 37.8% and 34%, respectively. In other words, this leadership pushes AMZN above and beyond any incoming competition.
Moving into technical analysis, our Schaeffer’s Volatility Scorecard (SVS) is a lagging indicator that measures a stock’s realized volatility against the volatility expectations priced into that equity’s options over the past year. Currently, Amazon.com stock sports an SVS of 88 out of a possible 100, indicating the security tends to outperform said expectations – a boon for buyers.

Image and article originally from www.schaeffersresearch.com. Read the original article here.

