

Among the underlying components of the Russell 3000 index, we saw noteworthy options trading volume today in Antero Resources Corp (Symbol: AR), where a total of 20,501 contracts have traded so far, representing approximately 2.1 million underlying shares. That amounts to about 43.5% of AR’s average daily trading volume over the past month of 4.7 million shares. Particularly high volume was seen for the $29 strike call option expiring January 19, 2024, with 2,159 contracts trading so far today, representing approximately 215,900 underlying shares of AR. Below is a chart showing AR’s trailing twelve month trading history, with the $29 strike highlighted in orange:
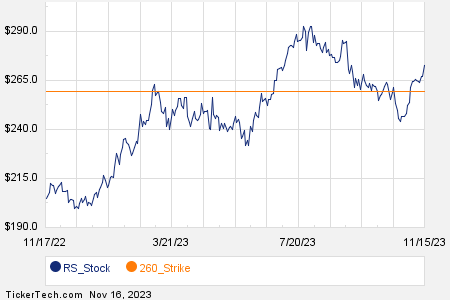
Reliance Steel & Aluminum Co. (Symbol: RS) saw options trading volume of 1,476 contracts, representing approximately 147,600 underlying shares or approximately 43.4% of RS’s average daily trading volume over the past month, of 340,045 shares.
Especially high volume was seen for the $260 strike call option expiring November 17, 2023, with 560 contracts trading so far today, representing approximately 56,000 underlying shares of RS. Below is a chart showing RS’s trailing twelve month trading history, with the $260 strike highlighted in orange:
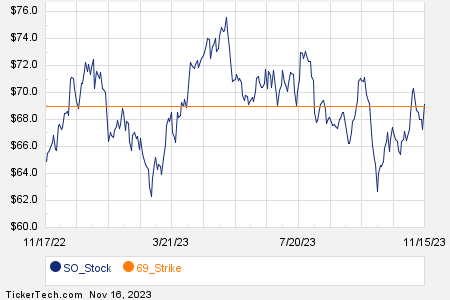
And Southern Company (Symbol: SO) saw options trading volume of 20,431 contracts, representing approximately 2.0 million underlying shares or approximately 43% of SO’s average daily trading volume over the past month, of 4.7 million shares.
Particularly high volume was seen for the $69 strike call option expiring November 17, 2023, with 7,929 contracts trading so far today, representing approximately 792,900 underlying shares of SO. Below is a chart showing SO’s trailing twelve month trading history, with the $69 strike highlighted in orange:
For the various different available expirations for AR options, RS options, or SO options, visit StockOptionsChannel.com.
Today’s Most Active Call & Put Options of the S&P 500 »
Also see:
Stocks Being Sold By Hedge Funds
RAPT market cap history
AGMH Videos
The views and opinions expressed herein are the views and opinions of the author and do not necessarily reflect those of Nasdaq, Inc.
Image and article originally from www.nasdaq.com. Read the original article here.