The SPX has a history of struggling underneath its 200-day moving average
It’s no secret the S&P 500 Index (SPX) has struggled this year, down almost 20% year-to-date. Its current 143-day stint below its 200-day moving average is the 13th longest streak since 1950, and the longest streak since the financial collapse of 2008. Should this lengthy period below such an important trendline be worrisome, and is a close above the trendline is an ‘all-clear’ signal?
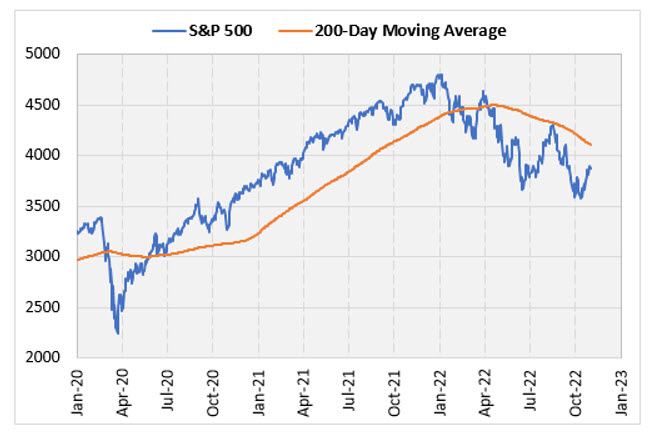
It’s Been 143 Days …
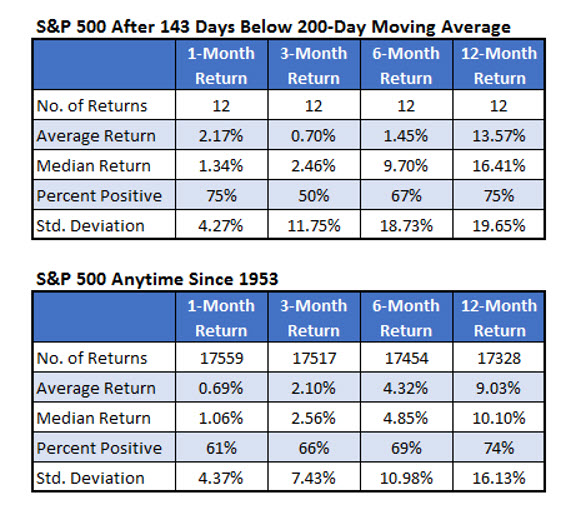
The table below summarizes the S&P 500 returns after the 143rd trading day below its 200-day moving average. The second table considers all days since 1953, the year of the first signal. The results are very mixed depending on the timeframe. The one-month returns have been strong but the three and six-month returns have been weak. What’s interesting, however, is the median and percent positive stats look fine but the average return shows underperformance. This indicates some big losses after some of the signals. The returns a full year after these signals shows slight outperformance.
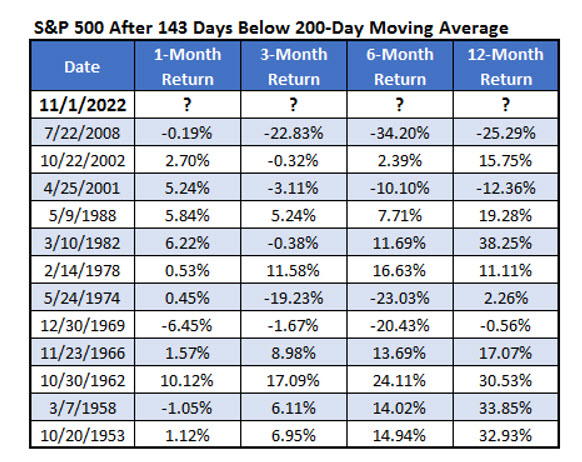
This table shows the individual returns after the S&P 500 was below its 200-day moving average for 143 trading days. As the table above suggested, there are a couple huge moves to the downside after prior signals. The last time this happened, in mid-2008, was one such signal. The S&P 500 was down over 20% three months later and down over 30% six months later. After the 1974 signal, the index lost 19% over the next three months and lost 23% over the next six months.
‘All-Clear’ for Stocks?
The S&P 500 sits about 6% below the 200-day moving average. It may not be long before the index gets back above this tricky trendline. Based on the data below, this has been a solid buy signal. The table below shows how the index has performed after its first close above the 200-day moving average after these extended streaks below the moving average. It’s close to an all-clear signal. Six months after it closes above the moving average, it was positive 92% of the time averaging a gain of 11.6%. One year after these signals, it averaged a gain of 18% and again, with 92% of the returns positive.
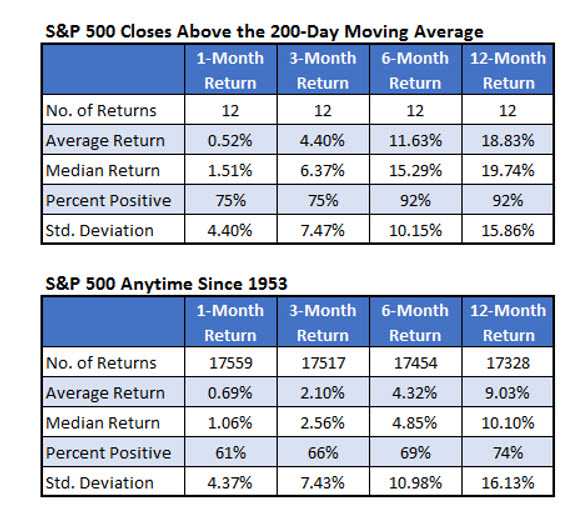
This last table shows the dates of the first close above the 200-day moving average. I also show the total trading days the index spent below the 200-day moving average. The longer-term returns are impressive. Ten out of the 12 six-month returns were double-digit gains. Half of the 12-month returns were higher than 20%.
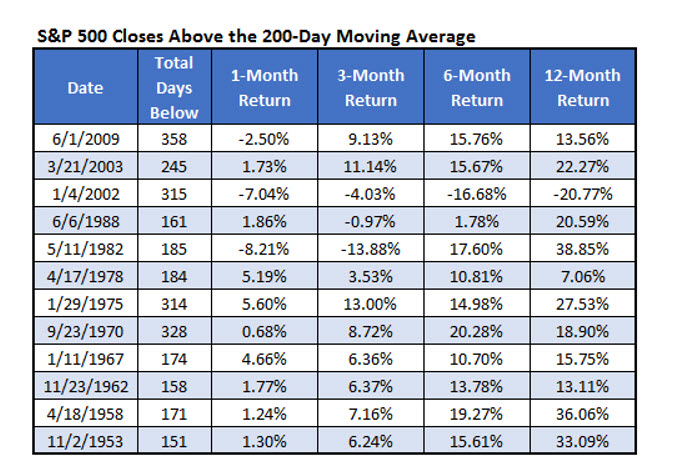
Image and article originally from www.schaeffersresearch.com. Read the original article here.

