
For stock market investors, an inverted yield curve is a sign that an economic recession could be on the way.
X
An inverted yield curve occurs when long-term government debt yields fall below rates on short-term notes and bills.
Concerns are building that the Federal Reserve’s tightening could push the U.S. economy into recession. Amid soaring inflation, markets are pricing in a probability that the Fed will raise interest rates by 100 basis points to a range of 2.5% to 2.75% at its July 26 to 27 meeting.
The 2-year/10-year spread on Wednesday hit levels not seen since Sept. 26, 2000 — warning of a potential economic downturn. As of July 14, the yield curve spread between the 2-year and 10-year Treasuries is solidly inverted at minus 24 basis points.
U.S. stocks plunged in August 2019 as the main Treasury yield curve inverted, with the two-year yield above the 10-year Treasury yield for the first time since 2007. However, it turned out to be a false alarm as the U.S. economy kept humming through the rest of 2019.
Bank stocks such as Bank of America (BAC), JPMorgan (JPM), Citigroup (C) and Wells Fargo (WFC) usually sell amid a yield curve inversion. One view is that high-yielding dividend stocks — such as AT&T (T) and Verizon Communications (VZ) — outperform. Telecom stocks have outperformed thus far in 2022.
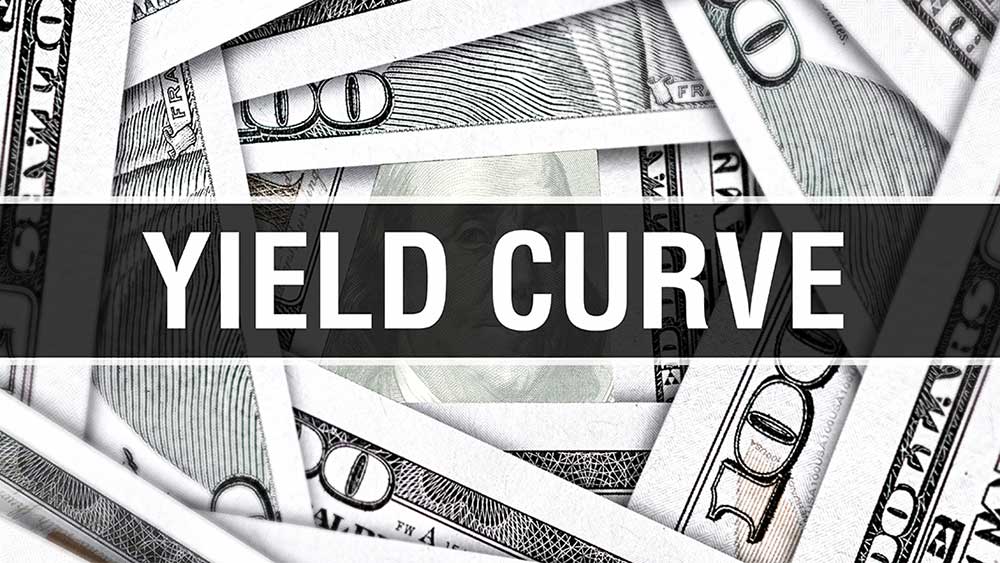
What Is An Inverted Yield Curve?
Simply put, an inverted yield curve occurs when short-term rates surpass those of long-term notes. U.S. Treasuries are bonds, or debt, sold by the federal government.
A closely watched indicator for an inverted yield curve is when the yield of three-month Treasury bills rises above the yield for 10-year Treasuries. This partial inversion has been going on for months.
But the classic inverted yield curve is when the 10-year yield falls below that of the two-year yield.
A steeper yield curve occurs when the gap between short-term and long-term bond rates increases. It’s the opposite of a flattening curve.
The flattening of the yield curve had been a trend since around 2013.
While an inverted yield curve has been a reliable indicator of slowing U.S. economies, the timing of an upcoming recession has been uncertain. Historically, prolonged “curve inversions” have usually preceded major economic slowdowns by about a year.
Banks Stocks And Inverted Curve
In 2000, U.S. stock markets imploded amid over-investment in unprofitable internet companies and telecom networks.
While an inverted yield curve can signal that the risk of recession is rising, global monetary policy remains equity-market friendly, analysts say. A solid U.S. labor market continues to support consumption.
Bank stocks are a key sector to watch because a yield curve is associated with a credit crunch. It’s said that banks stop lending when the rates they pay in money markets on their deposits and their borrowings exceed the rates they charge on the loans they make to businesses and households.
If you’re new to IBD, consider taking a look at its stock trading system and CAN SLIM basics. Recognizing chart patterns is one key to the investment guidelines.
IBD offers a broad range of growth stock lists, such as Leaderboard. Investors also can create watch lists, find companies nearing a buy point, or develop custom screens at IBD MarketSmith.
Follow Reinhardt Krause on Twitter @reinhardtk_tech for updates on 5G wireless, artificial intelligence, cybersecurity and cloud computing.
YOU MAY ALSO LIKE:
Bear Market News And How To Handle A Market Correction
Best Growth Stocks To Buy And Watch: See Updates To IBD Stock Lists
Chart Reading For Beginners: Nvidia, Amazon, Pinterest Reveal This Key Investing Skill
How To Use The 10-Week Moving Average For Buying And Selling
Image and article originally from www.investors.com. Read the original article here.