

TLT has been facing off with its 200-day moving average
Subscribers to Chart of the Week received this commentary on Sunday, September 11.
Around this time last year, my colleague covered the iShares 20+ Year Treasury Bond ETF (TLT), via a Bloomberg article about famed short-seller Michael Burry, who made a name for himself by betting against, and ultimately calling, the housing bubble. Burry’s fund purchased $280 million in puts against the TLT and within months the ETF suffered a sharp selloff.
Since this aforementioned selloff, TLT has seen a significant long-term pullback. Investors have been able to buy and sell long-term U.S. Treasuries via ETFs in the market for around 20 years, making now a good time to dig deeper into the iShares 20+ Year Treasury Bond ETF, and more specifically, what’s been the main catalyst behind both the recent and long-term volatility for the shares.
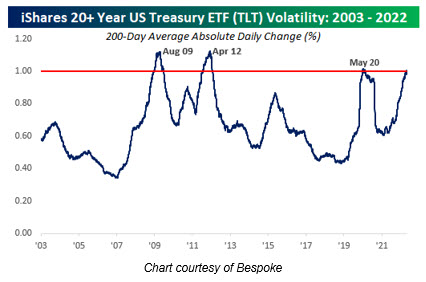
Many of these catalysts feel obvious, including the housing market crash in 2008, and a long-term credit rating fallout in 2011. Most recently was the Covid-19 spectacle, which, per Bespoke, “wreaked havoc on the Treasury market.” In fact, the short-lived push above 1% came to be an extreme example of volatility, with the ETF finding some stability by June 2021.
Now, the 200-day average daily shift hit 1% for the first time in over two years earlier this summer, in response to the recent buzz surrounding inflation rates from the U.S. Federal Reserve. As Wall Street continues to monitor the Fed’s hawkish comments closely, volatility seems imminent for the near term.
To garner a more technical outlook, it appears as though calls have been preferred over puts in the last two weeks. This is per the ETF’s 10-day call/put volume ratio of 1.87 at the International Securities Exchange (ISE), Cboe Options Exchange (CBOE), and NASDAQ OMX PHLX (PHLX), which ranks in the 92nd annual percentile.
Echoing this, the security’s Schaeffer’s put/call open interest ratio (SOIR) of 0.43 stands higher than just 19% of annual readings. This means short-term options traders have rarely been more call-biased.
Short interest has also been climbing, up more than 16% during the most recent reporting period. This accounts for 8% of the stock’s total available float, and would take short sellers just one day to buy back these bearish bets.
Image and article originally from www.schaeffersresearch.com. Read the original article here.