

Several technical indicators are making the XLF pullback interesting
Subscribers to Chart of the Week received this commentary on Sunday, March 19.
The Financial Select Sector SPDR Fund (XLF) is a diversified fund that covers a variety of industries in the banking realm, which – if you haven’t heard — has seen copious amounts of attention over the past week and a half. Following the SVB Financial Group’s (SIVB) collapse exactly two weeks ago, Wall Street has been a canister of chaos, with many investors once more looking to the government for solution and direction. While some worries have been stemmed, others have buoyed, though more ease came the morning of this writing, when First Republic Bank (FRC) received its own defibrillator.
No fewer than 11 bank names, including Bank of America (BAC) and Goldman Sachs (GS), rounded up $30 billion to aid their sector peer from joining SIVB in the mausoleum. However, the major indexes are eyeing yet another steep daily loss, while the XLF also sits deep in the red at midday.
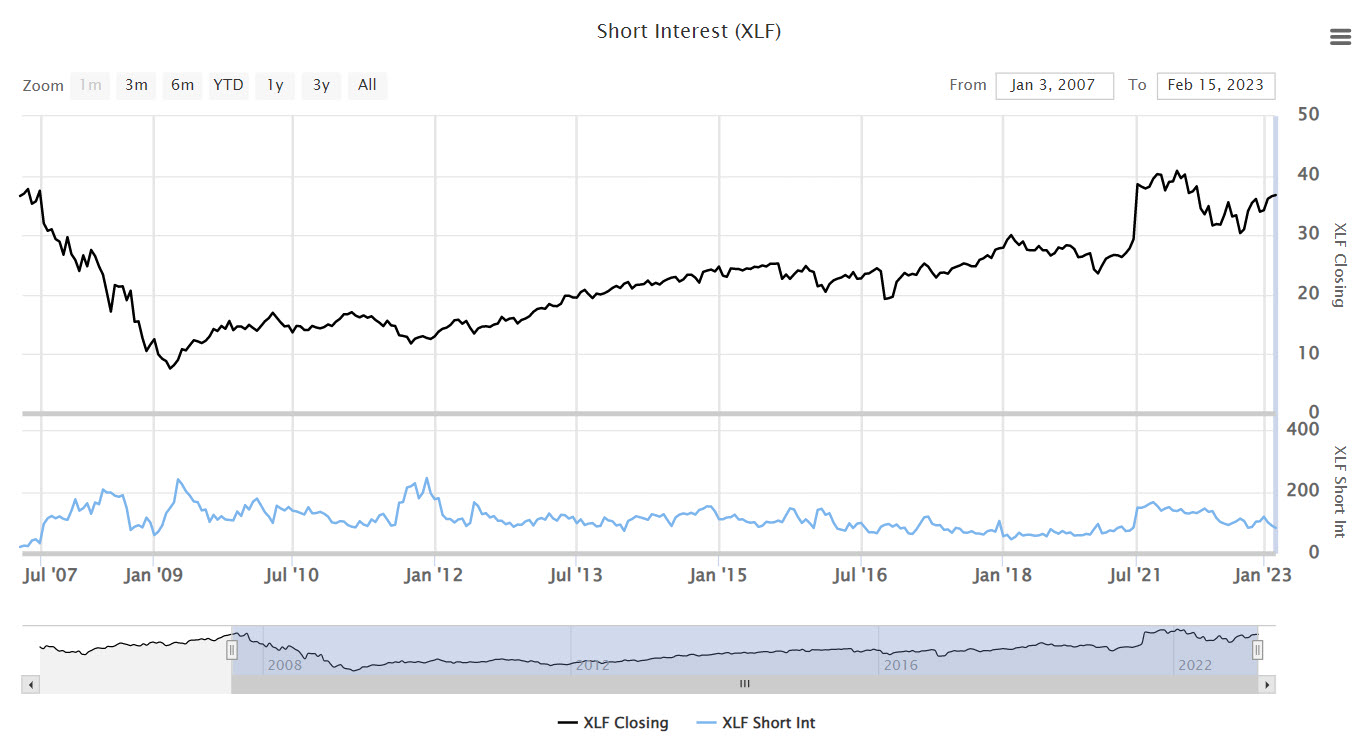
Several technical indicators are making this pullback especially interesting for XLF. Back in 2008 amid the historic financial crisis, XLF calls were used as a hedge to the process of mass shorting finance stocks. The government subsequently placed a regulatory ban against short-selling finance stocks — mostly out of fear that the practice was driving the steep price drops on the market. The ban was eventually lifted due to restrictive challenges that would exacerbate broader-market pullbacks. Below you can take a closer look at the movement of short interest (blue) vs. the stock’s share price (black).
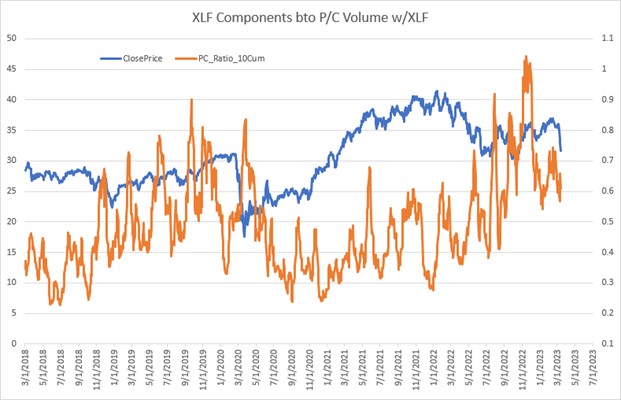
Historically, the buy-to-open call/put ratio has soared simultaneously alongside shorting activity. However, per Schaeffer’s Senior V.P. of Research Todd Salamone, the ratio declined when the regulatory ban took place. As of March 13, the put/call ratio sits at 0.61, and the heavy selling on XLF has caused an increase in another favorite indicator of Schaeffer’s.
The gamma-weighted Schaeffer’s Open Interest Ratio (SOIR) is unique because while the latter SOIR looks at open interest from the front three expiration months, the gamma-weighted scans open interest depending on the option’s gamma. For the gamma-weighted SOIR, we multiply the option’s gamma by its put open interest, and then we multiply it by the option’s call open interest. Dividing the gamma-weighted puts by the gamma-weighted calls gets us the gamma-weighted SOIR. This indicator gives higher importance to open interest that is near-the-money, and disregards open interest that is either deep in-the-money, or deep out-of-the-money.
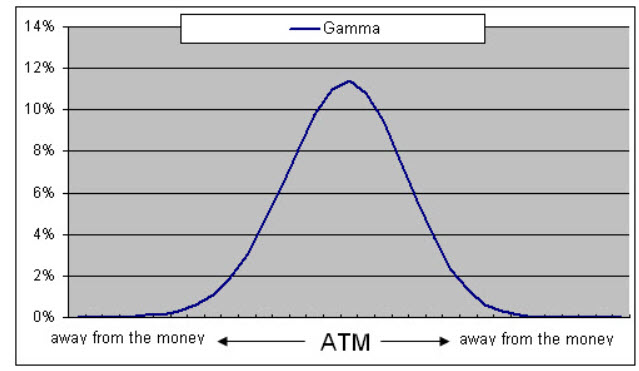
With that said, the Financial Select Sector SPDR Fund is carrying a gamma-weighted SOIR of 2.64, which, per history, is a bullish indicator. In other words, if the stock rises, it makes a trader’s put options less likely of being in-the-money and decreases chances of having to pay out money at expiration. As the stock price goes up, the trader can cover their short position, which is a further tailwind for the stock and its sector peers amid a historically volatile period.
Image and article originally from www.schaeffersresearch.com. Read the original article here.