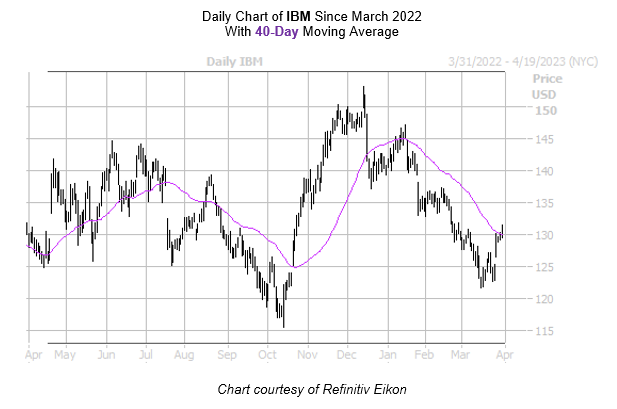
IBM has been struggling on the charts since its mid-December peak
IBM Common Stock (NYSE:IBM) has struggled on the charts since pulling back from its Dec. 13 three-year high of $153.21. The blue-chip tech concern was last seen 0.2% lower at $129.51, and trading near its 40-day moving average, a trendline that happens to flash a signal for short-term options bears, if history is any indicator.
According to Schaeffer’s Senior Quantitative Analyst Rocky White, there were five prior instances of IBM stock trading within one standard deviation of its 40-day moving average after a lengthy stretch of time spent below it (defined as 80% of the time over the preceding two months, and at least eight of the previous 10 trading days), looking back three years. The stock was lower one month later 80% of the time, averaging a 2.5% loss.

An unwinding of optimism among options traders could generate additional headwinds, too. At the International Securities Exchange (ISE), Cboe Options Exchange (CBOE), and NASDAQ OMX PHLX (PHLX), IBM’s 10-day call/put volume ratio of 2.37 sits higher than 96% of annual readings, indicating long calls have been picked up at a much quicker-than-usual clip.
For those that want to take advantage, IBM stock is seeing well-priced premiums at the moment. The security’s Schaeffer’s Volatility Index (SVI) of 27% stands in the relatively low 28th percentile of readings from the past 12 months, implying that options players are pricing in low volatility expectations at the moment.
Image and article originally from www.schaeffersresearch.com. Read the original article here.

