When the SPX wins — and wins big — in January, it usually means more gains to come
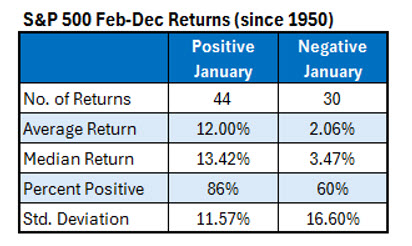
The S&P 500 Index (SPX) is off to a good start for the year, with a 3% lead heading into the last day of January. This positive start is often considered an auspicious sign for the remainder of the year. The January Barometer is a well-known seasonality indicator that has been a reliable guide for the remaining months. As you can see from the table below, stocks have performed exceptionally well over the next 11 months following a positive January. Otherwise, they’ve been subpar. Schaeffer’s Managing Editor Emma Duncan already wrote about the January Barometer here, but In this article, I delve deeper into the numbers to assess whether the outlook for the rest of the year remains optimistic given our current market circumstances.

Stock Performance After a Big Year
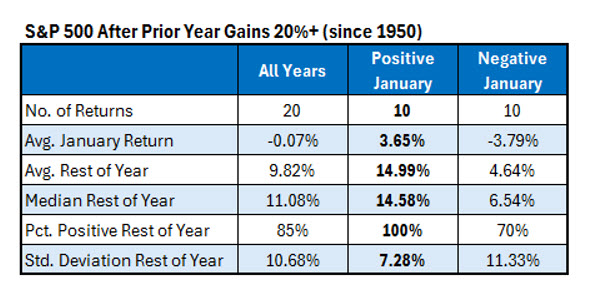
The S&P 500 gained 24% in 2023, a strong year for stocks. I was curious how stocks have tended to behave after these overwhelmingly positive years. The table below summarizes S&P 500 returns following years with gains of at least 20%, a phenomenon observed 20 times in the past. January has averaged a slight loss after these instances, with exactly half of them positive. It’s good news that the market is up this January. In the 10 instances when January was positive after a 20% or more gain for the index in the previous year, the S&P 500 averaged a 15% return for the rest of the year, with all 10 returns positive.

Ending January Near All-Time Highs
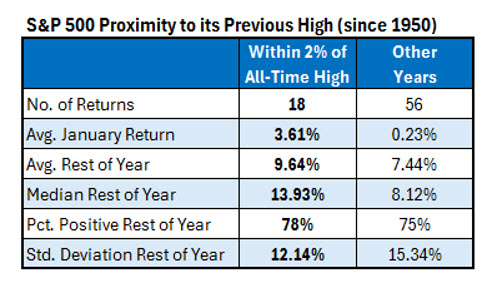
With one day left of this month’s trading, the S&P 500 also sits very close to its all-time high. The table below shows how the S&P 500 performed based on its proximity to the all-time high at the end of January. When the index was within 2% of its all-time high it averaged a gain of 9.64% for the rest of the year with 78% of the returns positive. Other years, the index averaged a gain of 7.44% with 75% of returns positive. So, it doesn’t show clear outperformance, but there’s also no increased likelihood of a pullback in the calendar year either.

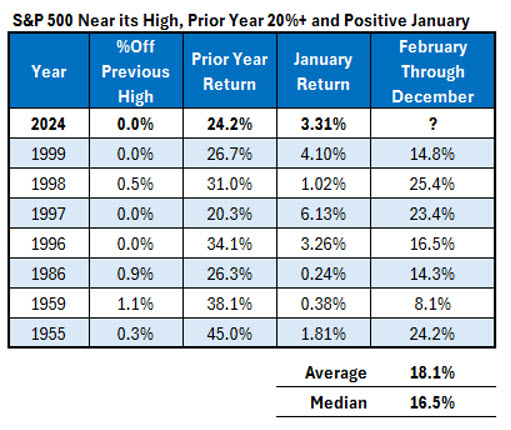
Finally, let’s put all these scenarios together. The table below shows each of the years since 1950 in which the S&P 500 was positive in January and finished the month within 2% of its all-time high after a year in which it gained at least 20%. There were seven years in which this occurred. The index averaged a return of 18% for the rest of the year with all returns positive. It failed to gain double digits over the last 11 months of the year only one time. That year, 1959, it gained an adequate 8% for the rest of the year. Based on the numbers in this article, 2024 is set up for a bullish year.

Image and article originally from www.schaeffersresearch.com. Read the original article here.

