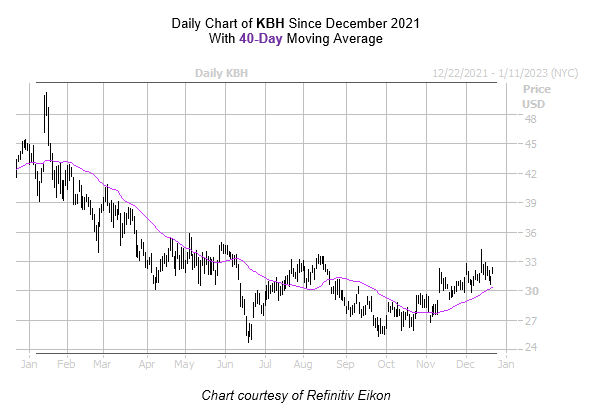
KB Home stock is trading near its historically bullish 40-day moving average
Housing data released today shows sales for existing U.S. homes hit a two-and-a-half year low in November, as higher mortgage rates gripped the market. Existing home sales fell 7.7% to their lowest level since May 2020, according to the National Association of Realtors, resulting in 10-straight months of declining sales — the longest such stretch since 1999.
This makes now a good time to keep an eye on homebuilding concern KB Home (NYSE:KBH), which is down 27.7% in the last 12 months. Though the shares were last seen 3.4% higher to trade at 32.41, they remain well below their May 2021, roughly 15-year high of $52.48. However, a recent study from Schaeffer’s Senior Quantitative Analyst Rocky White shows that KBH could see some gains in the coming month.
Per White’s data, the security is within one standard deviation of its 40-day moving average. Over the last three years, KB Home stock saw three similar signals, and one month after one of these signals, the equity was 4% higher on average. A move of this magnitude from KBH’s current perch would place shares at $33.70.

An unwinding of options traders’ pessimism could help add some additional tailwinds. KB Home stock’s Schaeffer’s put/call open interest ratio (SOIR) of 1.67 ranks in the 71st percentile of annual reading, suggesting short-term options traders are more put-biased than usual at the moment.
Image and article originally from www.schaeffersresearch.com. Read the original article here.

