“With resistance overhead, the SPX has a multitude of potential support areas that bears should pay attention to before getting too excited about last week’s decline…it isn’t a good time to chase stocks right here, given the potential resistance overhead and central bankers meeting in Jackson Hole, Wyoming this week. I would not be unloading long positions yet and instead consider hedging long positions, as the Cboe Market Volatility Index (VIX—20.60) is around a four-month low heading into this potentially pivotal event at Jackson Hole.”
“…the first line of potential support was broken in Friday’s trading, when the index fell back below the 4,262 area…Additional support is at 4,230, which is a 50% retracement of this year’s high and low and below that is the 4,160-4,170 area, site of the June highs and its upward-sloping 20-day moving average. If the SPX declines back below the June highs, I think this would be the time to begin de-risking.”
-Monday Morning Outlook, August 21, 2022
After a much-anticipated speech Friday morning by Fed Chair Jerome Powell outlining how he views fighting inflation in the months ahead, the bears seized control. For the second consecutive week, equities finished lower, with disappointments for bulls from a technical perspective.
For example, two weeks ago during standard August expiration week, the S&P 500 Index (SPX—4,057.66) was rejected at a multi-pronged resistance area stemming from an option-related “call wall” at 4,300, in addition to its 200-day moving average and the level that corresponds with the round 10% below last year’s close (4,289). By that week’s end, the index was below its first potential level of support at 4,262, which was its close ahead of the first rate hike this year.
The technical environment deteriorated last week, after the SPX fell below 4,230 and the 4,160-4,170 area, levels of potential importance as described in the second excerpt above from last week’s commentary and seen in the below graph. Moreover, last Monday morning’s gap lower produced another bearish technical omen known as a “bearish island reversal” pattern, in which the Aug. 10 gap higher was followed by the Aug. 22 gap lower. To add insult to injury, Friday’s action can be classified as a bearish outside day, with the SPX’s intraday high above the previous day’s peak and the low and close below the prior day’s low.
After listening to Powell’s short speech, I think he simply reiterated what he has been saying the past few months in terms of stamping out inflation. Unnerving stock investors, perhaps, is when he clarified that the Fed does not see the “neutral rate” as necessarily being a level at which the Fed stops or pauses rate hikes.
As such, stocks sold off, as equity participants were likely caught off guard to the possibility of the Fed moving from an accommodative policy to a restrictive policy instead of moving from accommodate to neutral.
However, fed funds futures participants did not seem as surprised, leaving me to wonder if a restrictive policy is factored more into the stock market than what Friday’s price action suggested.
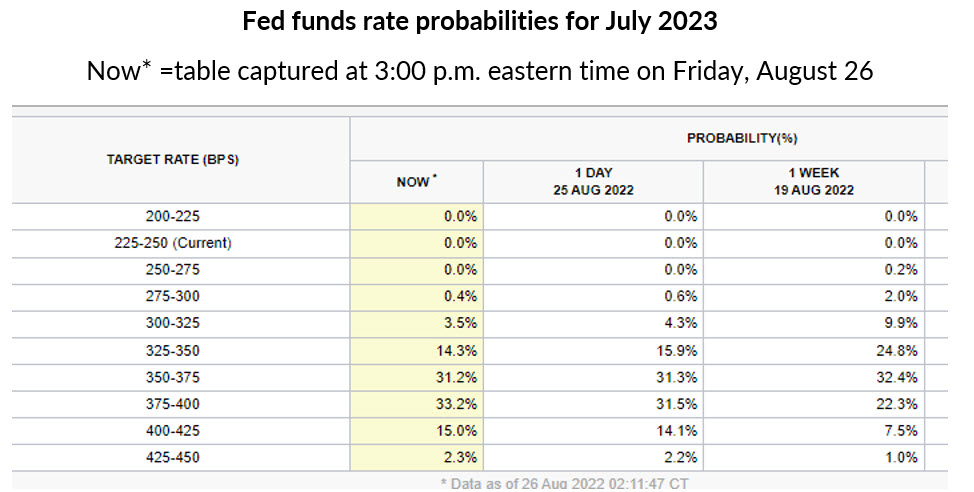
For example, the table below, from the Chicago Mercantile Exchange’s (www.cmegroup.com) web site, shows the probability of where the fed funds rate will be as of the July 2023 meeting. Catching my eye is that the probabilities did not change all the much from another 100 basis points of tightening between now and then.

If much of Friday’s perceived “hawkishness” from Powell is mostly factored into the market, it would suggest that little downside remains relative to Friday’s close. If that is the case, I see the next level of potential support coming from the SPX’s 50-day moving average at the round 4,000-millenium mark.
Note in the SPX graph above that its 50-day moving average provided support on the short-term pullback in late-July that followed a breakout above a trendline connecting lower highs since the March peak. Although this is an area of potential support, bulls should not ignore the fact that risk has increased amid breaks below higher level of support amid the “bearish island reversal” pattern last Monday and the bearish outside day candlestick on Friday.
This suggests that if you did not hedge long positions as advised last week, you should lighten up on your long positions, with the potential of lightening up further if other support levels break, as depicted by the green line segments, horizontal lines and 50-day moving average in the chart above.
If hedging remains your preference, you could consider using calls on Cboe Market Volatility Index (VIX—25.56) futures. The shorter-term VIX futures are more sensitive to VIX movement, for what it is worth.
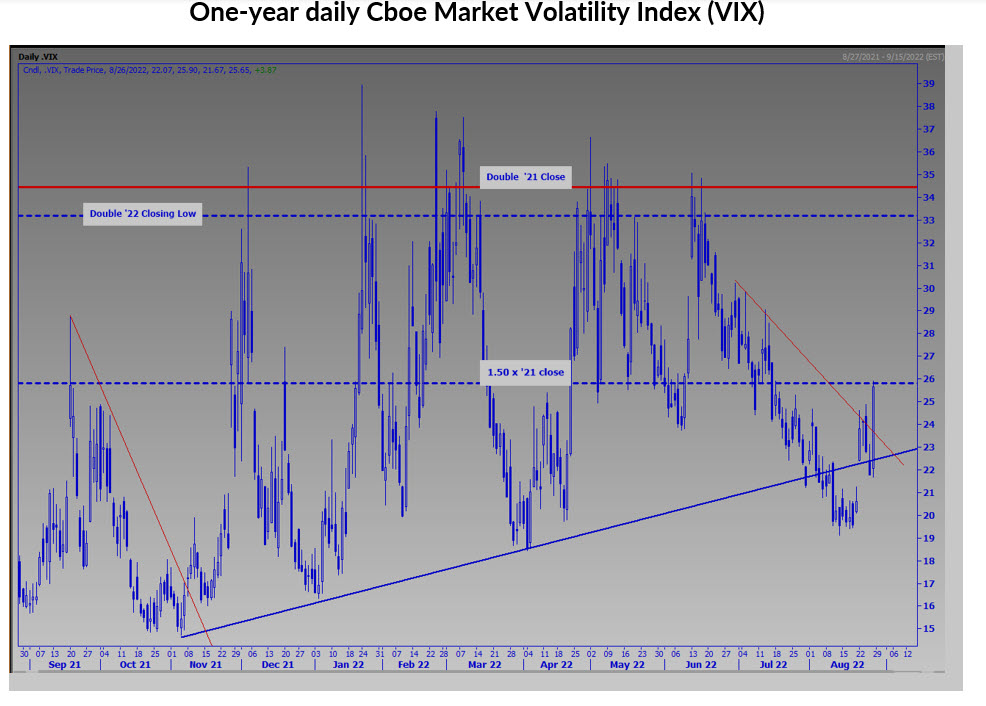
A risk to bulls is that we are embarking on another environment in which higher volatility expectations and lower stock prices are on the horizon. Per the VIX chart below, after volatility expectations cooled from June through mid-August, the VIX could be on the verge of “mean reverting” back to recent highs in 2022.
For example, the VIX’s sharp move back above a trendline connecting higher lows since November, after a recent and brief decline below this trendline in early August, is alarming. In addition, it closed above a short-term trendline connecting lower highs since month-end June. As long-time readers know, sometimes the VIX will pivot from round-number percentage levels. With that in mind, the 26 level is roughly 50% above the VIX’s 2021 close, and it closed just below this level on Friday.

Todd Salamone is a Senior V.P. of Research at Schaeffer’s Investment Research
Continue Reading:
Image and article originally from www.schaeffersresearch.com. Read the original article here.

