

Unpacking several investor indicator surveys
Subscribers to Chart of the Week received this commentary on Sunday, August 20.
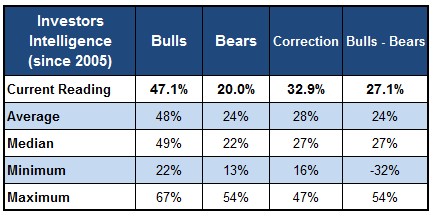
It’s been quite some time since we unpacked the weekly Investors Intelligence (II) survey, which covers more than 100 published newsletters to measure the percentage of bearish, bullish, or correction leaning analysts. Schaeffer’s Senior Quantitative Analyst Rocky White covered the survey’s outlook in late-June, concluding a bullish outlook for investors that crossed the 30% threshold. White also explored data on the history of Bulls vs. Bears moving within certain percentiles on the S&P 500 Index (SPX).
White found that it’s better when the bulls minus bears line is decreasing, at least in the next six months of the returns moving above 80th percentile. His original thought was that when the survey was showing increasing bullishness, we might be capturing earlier money flows, so more money coming in. However, it was gathered that “it’s better when the bulls minus bears line is decreasing, at least in the next six months. The 12-month returns show slightly better results when the line is increasing.”
Lo and behold, this past week’s mid-August reading showed a 5.1% decrease in the percentage of bulls among advisors, sending that vaunted bulls minus bears line below 30%. This steep of a drop hasn’t been seen in nine weeks and suggests a sudden extreme in investor pessimism.
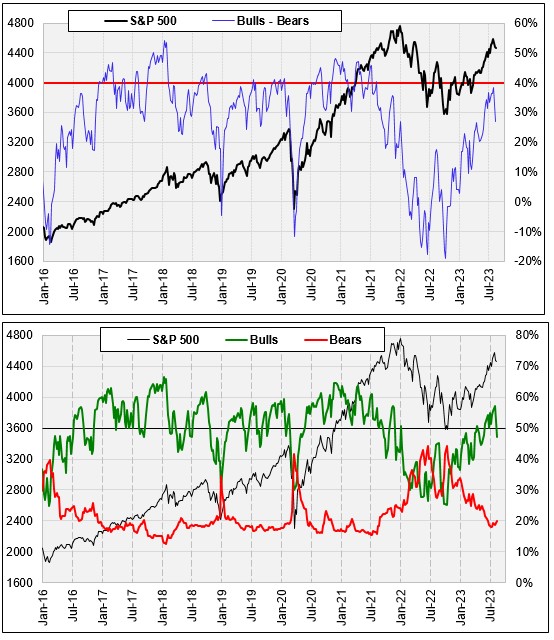
Bears have also moved below their long-term moving average to 20%, per typical data pulled since 2005. The bulls minus bears line does remain slightly higher than its long-term trendline, with a current reading of 27.1.
II isn’t the only sentiment survey registering a decent drop. As the broader market clocks another round of steep weekly losses, it’s no surprise that both the American Association of Individual Investors (AAII) and National Association of Active Investment Managers (NAAIM) showed a decline during the past couple weeks. Per Schaeffer’s Senior Market Analyst Chris Prybal, the AAII is showing its largest two-week drop since February, while the NAAIM all-time rank equals 37% — its largest monthly change since mid-March.
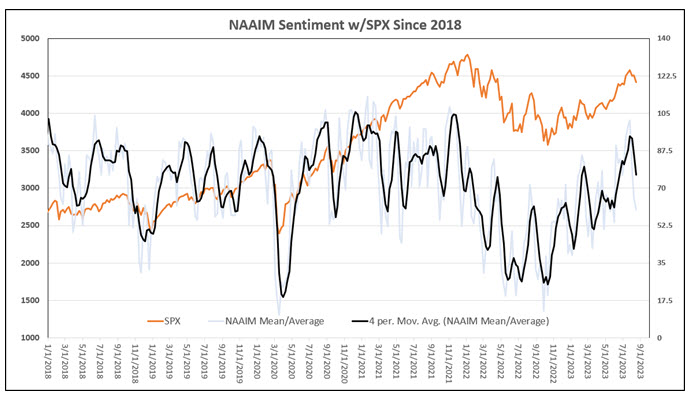
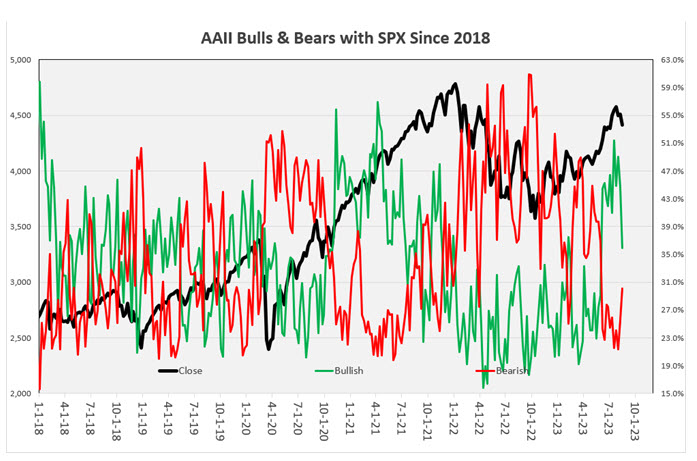
Image and article originally from www.schaeffersresearch.com. Read the original article here.