

An ETF tied to the Euro is a typical December outperformer
Subscribers to Chart of the Week received this commentary on Sunday, December 4.
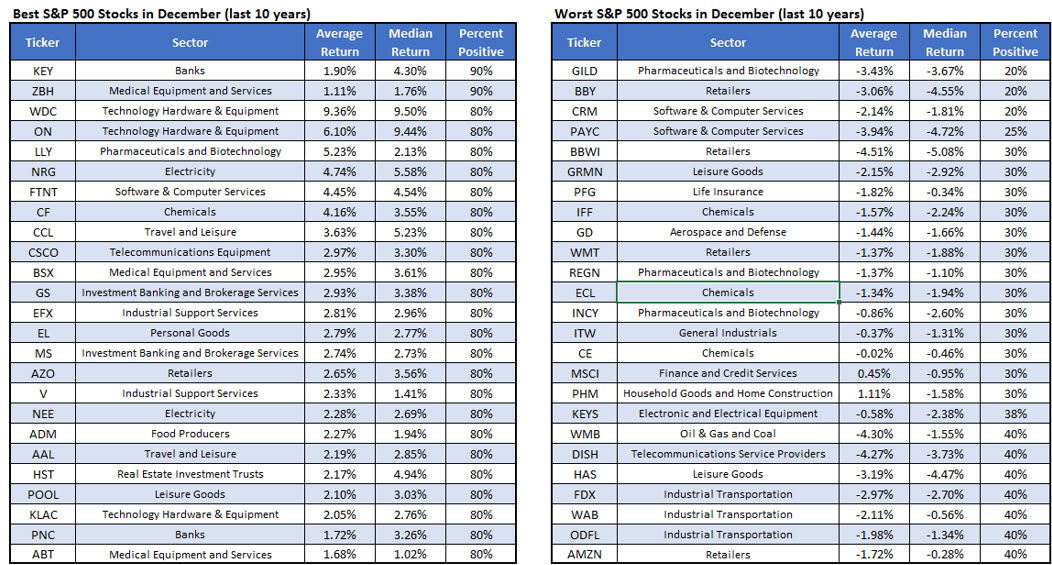
At Schaeffer’s, as each month comes to an end, we like to a look at historical data that shows us what to expect for stocks in the coming weeks. For example, thanks to data pulled from our own Senior Quantitative Analyst Rocky White, we have been focusing on the 25 best and worst S&P 500 Index (SPX) stocks to own during the month of December. Per the tables curated by White below, in the past 10 years the top three December performers have been KeyCorp (KEY), Zimmer Biomet (ZBH), and Western Digital (WDC), while the worst three performers have been Gilead Sciences (GILD), Best Buy (BBY), and Salesforce (CRM).
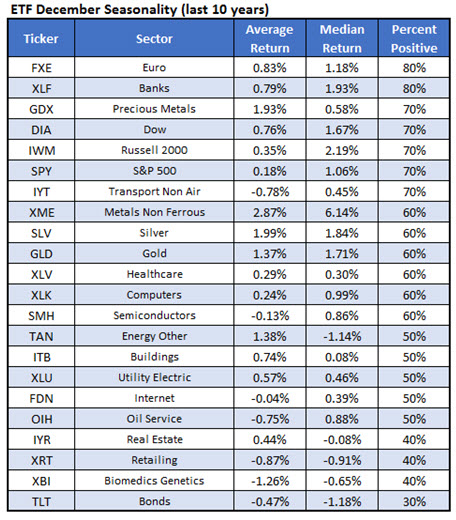
Switching gears slightly, I wanted to take a close look at the historical performance of exchange traded funds (ETF) around the holidays as well. In focus as the top performing ETF over the past 10 years is the Invesco CurrencyShares Euro Trust ETF (FXE). The euro-sector name has seen a median December gain of 1.2% over the past 10 years and has finished with a positive monthly gain in eight of those instances. A comparable move from FXE’s Thursday close of $97.10 would put the equity above $98, or levels not seen since June.
From a contrarian angle, the supporting options data is ripe for bulls. Specifically, albeit amid lighter absolute volume, puts have ruled the roost during the past two weeks. At the International Securities Exchange (ISE), Cboe Options Exchange (CBOE), and NASDAQ OMX PHLX (PHLX), FXE sports a 10-day put/call volume ratio of 11.39, which ranks in the 90th annual percentile. Most popular during this time period were the March 2023 93 and 95 puts, with the latter being sold to open.
Shorts have also been piling on, with short interest rising 75% during the most recent reporting period. This accounts for 27.6% of the stock’s total available float, or nearly five days’ worth of pent-up buying power.
From a technical standpoint, as of this writing FXE is slated to post its second consecutive close above the 200-day moving average for the first time since June 2021. The shares have struggled in 2022, now sporting an 8% deficit for the time frame, despite this past week breaking above recent resistance at the $96 level.
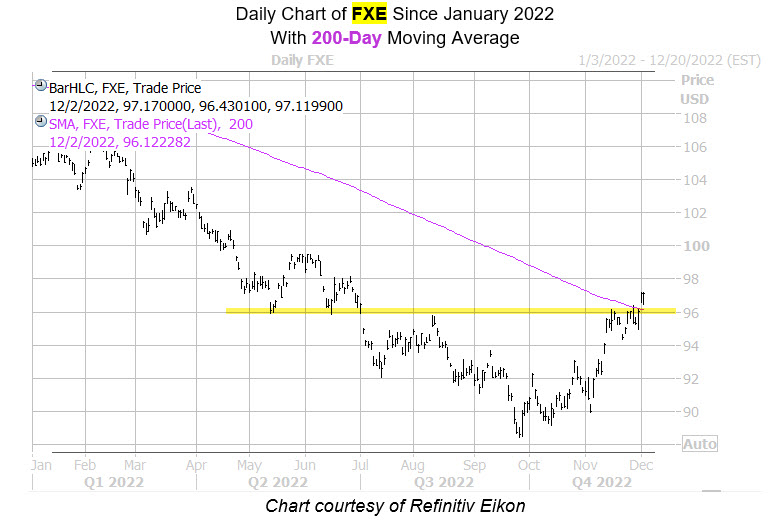
Image and article originally from www.schaeffersresearch.com. Read the original article here.