

Intellia Therapeutic’s stock (NASDAQ: NTLA), a biotechnology company developing treatments using the CRISPR gene-editing system, has seen a fall of 31% in a month, while it’s down 69% this year. This compares with -2% and -18% returns for the broader S&P500 index over the same periods, respectively. This recent underperformance can partly be attributed to the company’s decision to dilute its shareholding by issuing a fresh 6.6 million equity shares for $45.80, which was lower than the market price of $51.46 before the announcement late last month. This didn’t sit well with the investors. Furthermore, rising interest rates have made investors prioritize value stocks and companies with strong cash flows over loss-making futuristic themes.
But now that NTLA stock has seen a significant 31% fall in a month will it continue its downward trajectory, or is a rise imminent? Going by historical performance, there is a good chance of an increase in NTLA stock over the next month. NTLA stock has seen a move of -31% or more 54 times in the last seven years. Of those, 38 resulted in NTLA stock rising over the subsequent one-month period (twenty-one trading days). This historical pattern reflects 38 out of 54, or a 70% chance of a rise in NTLA stock over the coming month. See our analysis on Intellia Therapeutics Stock Chance of Rise for more details.
Calculation of ‘Event Probability‘ and ‘Chance of Rise‘ using the last seven years’ data
- After moving -4.7% or more over five days, the stock rose on 52% of the occasions in the next five days.
- After moving -20.2% or more over ten days, the stock rose on 67% of the occasions in the next ten days.
- After moving -31.0% or more over a twenty-one-day period, the stock rose on 70% of the occasions in the next twenty-one days.
This pattern suggests a higher chance of a rise in NTLA stock over the next five, ten, and twenty-one days.
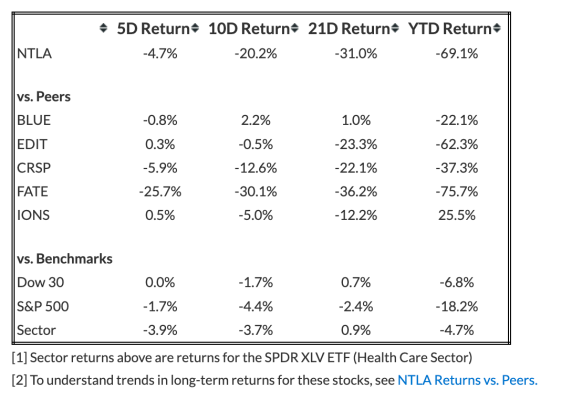
Intellia Therapeutics (NTLA) Stock Return (Recent) Comparison With Peers And S&P500
- Five-Day Return: IONS highest at 0.5%; FATE lowest at -25.7%
- Ten-Day Return: BLUE highest at 2.2%; FATE lowest at -30.1%
- Twenty-One Days Return: BLUE highest at 1.0%; FATE lowest at -36.2%
The Covid-19 crisis has created many pricing discontinuities which can offer attractive trading opportunities. For example, you’ll be surprised at how counter-intuitive the stock valuation is for Phibro Animal Health vs. Paramount Global.
What if you’re looking for a more balanced portfolio instead? Our high-quality portfolio and multi-strategy portfolio have beaten the market consistently since the end of 2016.
| Returns | Dec 2022 MTD [1] |
2022 YTD [1] |
2017-22 Total [2] |
| NTLA Return | -29% | -69% | 179% |
| S&P 500 Return | -5% | -18% | 74% |
| Trefis Multi-Strategy Portfolio | -4% | -21% | 218% |
[1] Month-to-date and year-to-date as of 12/16/2022
[2] Cumulative total returns since the end of 2016
Invest with Trefis Market-Beating Portfolios
See all Trefis Price Estimates
The views and opinions expressed herein are the views and opinions of the author and do not necessarily reflect those of Nasdaq, Inc.
Image and article originally from www.nasdaq.com. Read the original article here.