It occurred to me that some of our primary indicators have created a teachable moment. Specifically, our short-term and intermediate-term indicators are both at fairly extreme overbought levels, and now is a good time to talk about what that means.
The Swenlin Trading Oscillators for breadth and volume (STO-B and STO-V) are near the top of their normal range, and that usually coincides with short-term price tops. The IT Breadth and Volume Momentum Oscillators (ITBM and ITVM) are also near the top of their normal ranges, and that normally coincides with intermediate-term price tops. With indicators from both time frames at overbought levels, there is strong technical pressure for prices to make a noticeable decline.
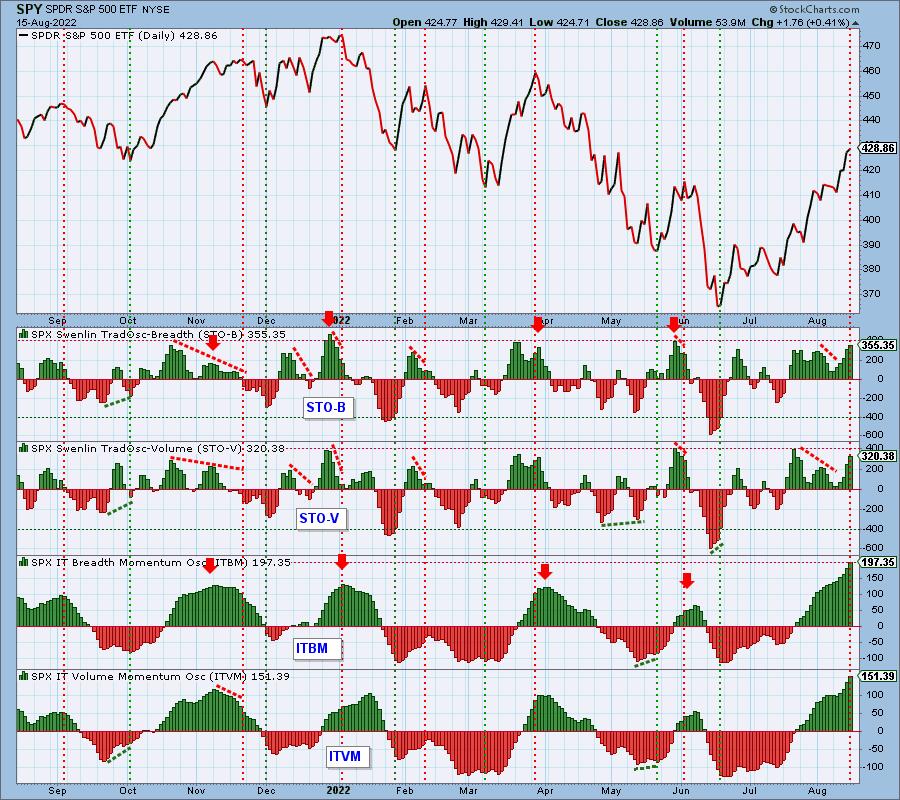
Conclusion: This condition occurs about every two to three months (see the red, downward pointing arrows for previous events), and it is fairly reliable as a top warning. While all four indicators are still rising, they are quite extended, so I would expect a price top soon, probably this week. Not guaranteed, just likely.

Technical Analysis is a windsock, not a crystal ball. –Carl Swenlin
(c) Copyright 2022 DecisionPoint.com
Helpful DecisionPoint Links:
DecisionPoint Alert Chart List
DecisionPoint Golden Cross/Silver Cross Index Chart List
DecisionPoint Sector Chart List
Price Momentum Oscillator (PMO)
Swenlin Trading Oscillators (STO-B and STO-V)
DecisionPoint is not a registered investment advisor. Investment and trading decisions are solely your responsibility. DecisionPoint newsletters, blogs or website materials should NOT be interpreted as a recommendation or solicitation to buy or sell any security or to take any specific action.