

Among the underlying components of the Russell 3000 index, we saw noteworthy options trading volume today in Salesforce Inc (Symbol: CRM), where a total of 116,990 contracts have traded so far, representing approximately 11.7 million underlying shares. That amounts to about 129.4% of CRM’s average daily trading volume over the past month of 9.0 million shares. Especially high volume was seen for the $150 strike call option expiring December 09, 2022, with 6,940 contracts trading so far today, representing approximately 694,000 underlying shares of CRM. Below is a chart showing CRM’s trailing twelve month trading history, with the $150 strike highlighted in orange:
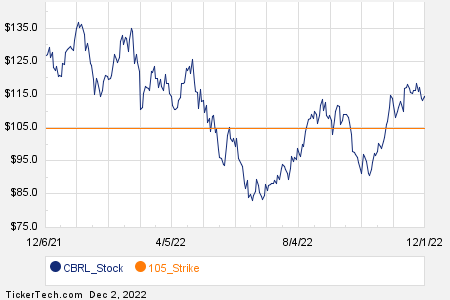
Cracker Barrel Old Country Store Inc (Symbol: CBRL) saw options trading volume of 4,176 contracts, representing approximately 417,600 underlying shares or approximately 120.5% of CBRL’s average daily trading volume over the past month, of 346,480 shares.
Especially high volume was seen for the $105 strike call option expiring December 16, 2022, with 738 contracts trading so far today, representing approximately 73,800 underlying shares of CBRL. Below is a chart showing CBRL’s trailing twelve month trading history, with the $105 strike highlighted in orange:
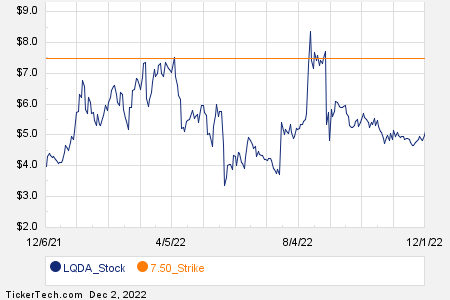
And Liquidia Corp (Symbol: LQDA) saw options trading volume of 4,226 contracts, representing approximately 422,600 underlying shares or approximately 108.4% of LQDA’s average daily trading volume over the past month, of 389,920 shares.
Particularly high volume was seen for the $7.50 strike call option expiring January 20, 2023, with 3,880 contracts trading so far today, representing approximately 388,000 underlying shares of LQDA. Below is a chart showing LQDA’s trailing twelve month trading history, with the $7.50 strike highlighted in orange:
For the various different available expirations for CRM options, CBRL options, or LQDA options, visit StockOptionsChannel.com.
Also see:
RE shares outstanding history
EAF Average Annual Return
TTPH shares outstanding history
The views and opinions expressed herein are the views and opinions of the author and do not necessarily reflect those of Nasdaq, Inc.
Image and article originally from www.nasdaq.com. Read the original article here.