Facing high inflation, the Zacks Retail and Wholesale sector has struggled in 2022, down more than 20% and lagging behind the general market by a notable margin.
A titan in the realm, Macy’s, Inc. M, is on deck to unveil quarterly earnings on November 17th, before the market open.
Macy’s is an omnichannel retail organization with a wide range of merchandise, including men’s, women’s, and children’s apparel and accessories, cosmetics, home furnishings, and other consumer goods.
Currently, the retail titan carries a Zacks Rank #3 (Hold) paired with an overall VGM Score of an A. How does everything else stack up?
Let’s take a closer look.
Share Performance & Valuation
Year-to-date, Macy’s shares are down roughly 18%, lagging behind the general market’s performance modestly.
Image Source: Zacks Investment Research
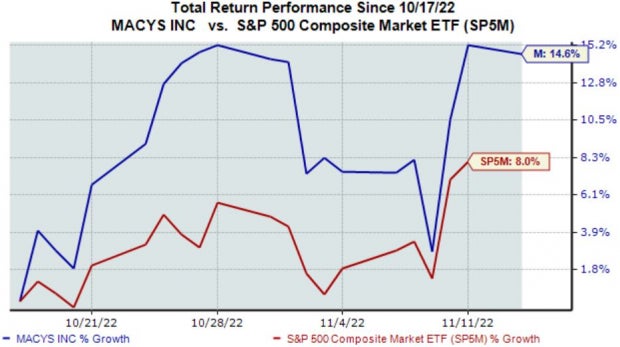
However, over the last month, the story has changed dramatically; M shares are up more than 14%, outperforming the S&P 500 by a notable margin.

Image Source: Zacks Investment Research
The company’s forward price-to-sales ratio currently sits at a small 0.2X, well below 0.5X highs in 2021 and representing a steep 81% discount relative to the Zacks Retail and Wholesale sector average of 1.2X.
Macy’s sports a Style Score of an A for Value.

Image Source: Zacks Investment Research
Quarterly Estimates
A singular analyst has upped their earnings outlook over the last several months, with the Zacks Consensus EPS Estimate of $0.19 indicating an 85% Y/Y drop in quarterly earnings.

Image Source: Zacks Investment Research
M’s top-line also appears to be undergoing some turbulence; the Zacks Consensus Sales Estimate of $5.2 billion suggests roughly a 4.8% decrease in revenue from year-ago sales of $5.4 billion.
Quarterly Performance
Macy’s earnings track record is more than impressive – the company has exceeded earnings and revenue estimates in eleven consecutive quarters.
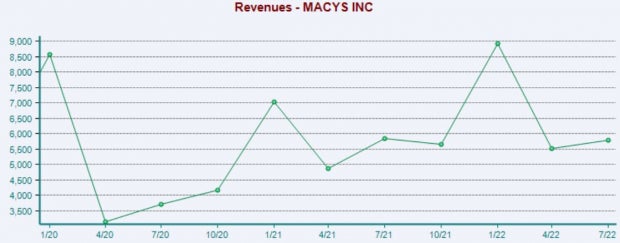
Just in its latest release, the retailer penciled in a sizable 17.6% EPS beat paired with a 2% sales surprise. Below is a chart illustrating the company’s revenue on a quarterly basis.

Image Source: Zacks Investment Research
Putting Everything Together
M shares have witnessed adverse price action year-to-date but have outperformed the general market by a fair margin over the last month, indicating that buyers have stepped up.
The company’s forward price-to-sales ratio is on the lower end of the spectrum, representing a sizable discount relative to the Zacks Retail and Wholesale sector average.
One analyst has upped their earnings outlook as of late, with estimates suggesting Y/Y decreases in revenue and earnings.
The company has been the definition of consistency within its quarterly results, regularly exceeding estimates.
Heading into the release, Macy’s Inc. M carries a Zacks Rank #3 (Hold) paired with an Earnings ESP Score of 19%.
Just Released: Free Report Reveals Little-Known Strategies to Help Profit from the $30 Trillion Metaverse Boom
It’s undeniable. The metaverse is gaining steam every day. Just follow the money. Google. Microsoft. Adobe. Nike. Facebook even rebranded itself as Meta because Mark Zuckerberg believes the metaverse is the next iteration of the internet. The inevitable result? Many investors will get rich as the metaverse evolves. What do they know that you don’t? They’re aware of the companies best poised to grow as the metaverse does. And in a new FREE report, Zacks is revealing those stocks to you. This week, you can download, The Metaverse – What is it? And How to Profit with These 5 Pioneering Stocks. It reveals specific stocks set to skyrocket as this emerging technology develops and expands. Don’t miss your chance to access it for free with no obligation.
>>Show me how I could profit from the metaverse!
Want the latest recommendations from Zacks Investment Research? Today, you can download 7 Best Stocks for the Next 30 Days. Click to get this free report
Macy’s, Inc. (M): Free Stock Analysis Report
To read this article on Zacks.com click here.
Zacks Investment Research
The views and opinions expressed herein are the views and opinions of the author and do not necessarily reflect those of Nasdaq, Inc.
Image and article originally from www.nasdaq.com. Read the original article here.

